Problem
Understanding the stock market requires aggregating data from multiple sources: stock exchanges, financial news outlets, SEC filings, and social media. This is a fragmented workflow due to context switching and information overload, leading to uncertainty and missed opportunities.
Solution
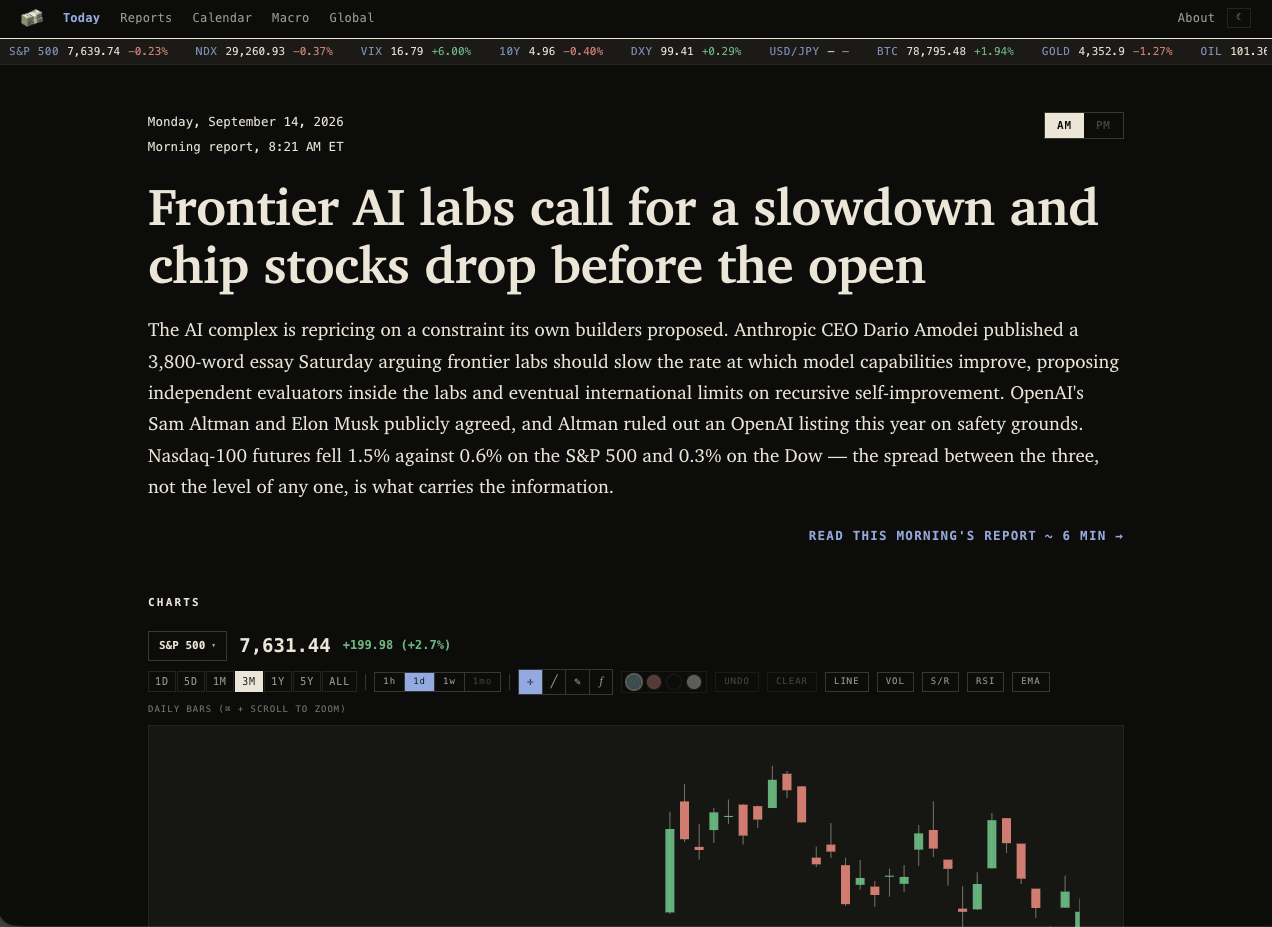
My solution was an automated market reporting website that aggregates information and generates daily reports so retail investors can quickly understand current events and make faster decisions.
Curating Market Context with AI
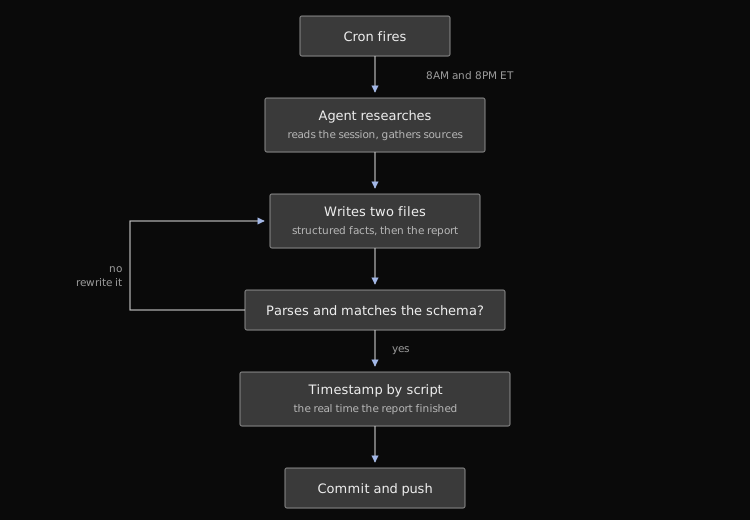
A research pipeline runs parallel web queries across market data, sentiment indicators, economic calendars, and a fixed set of stocks. The instructions file structures reports and defines the JSON schema for the website.
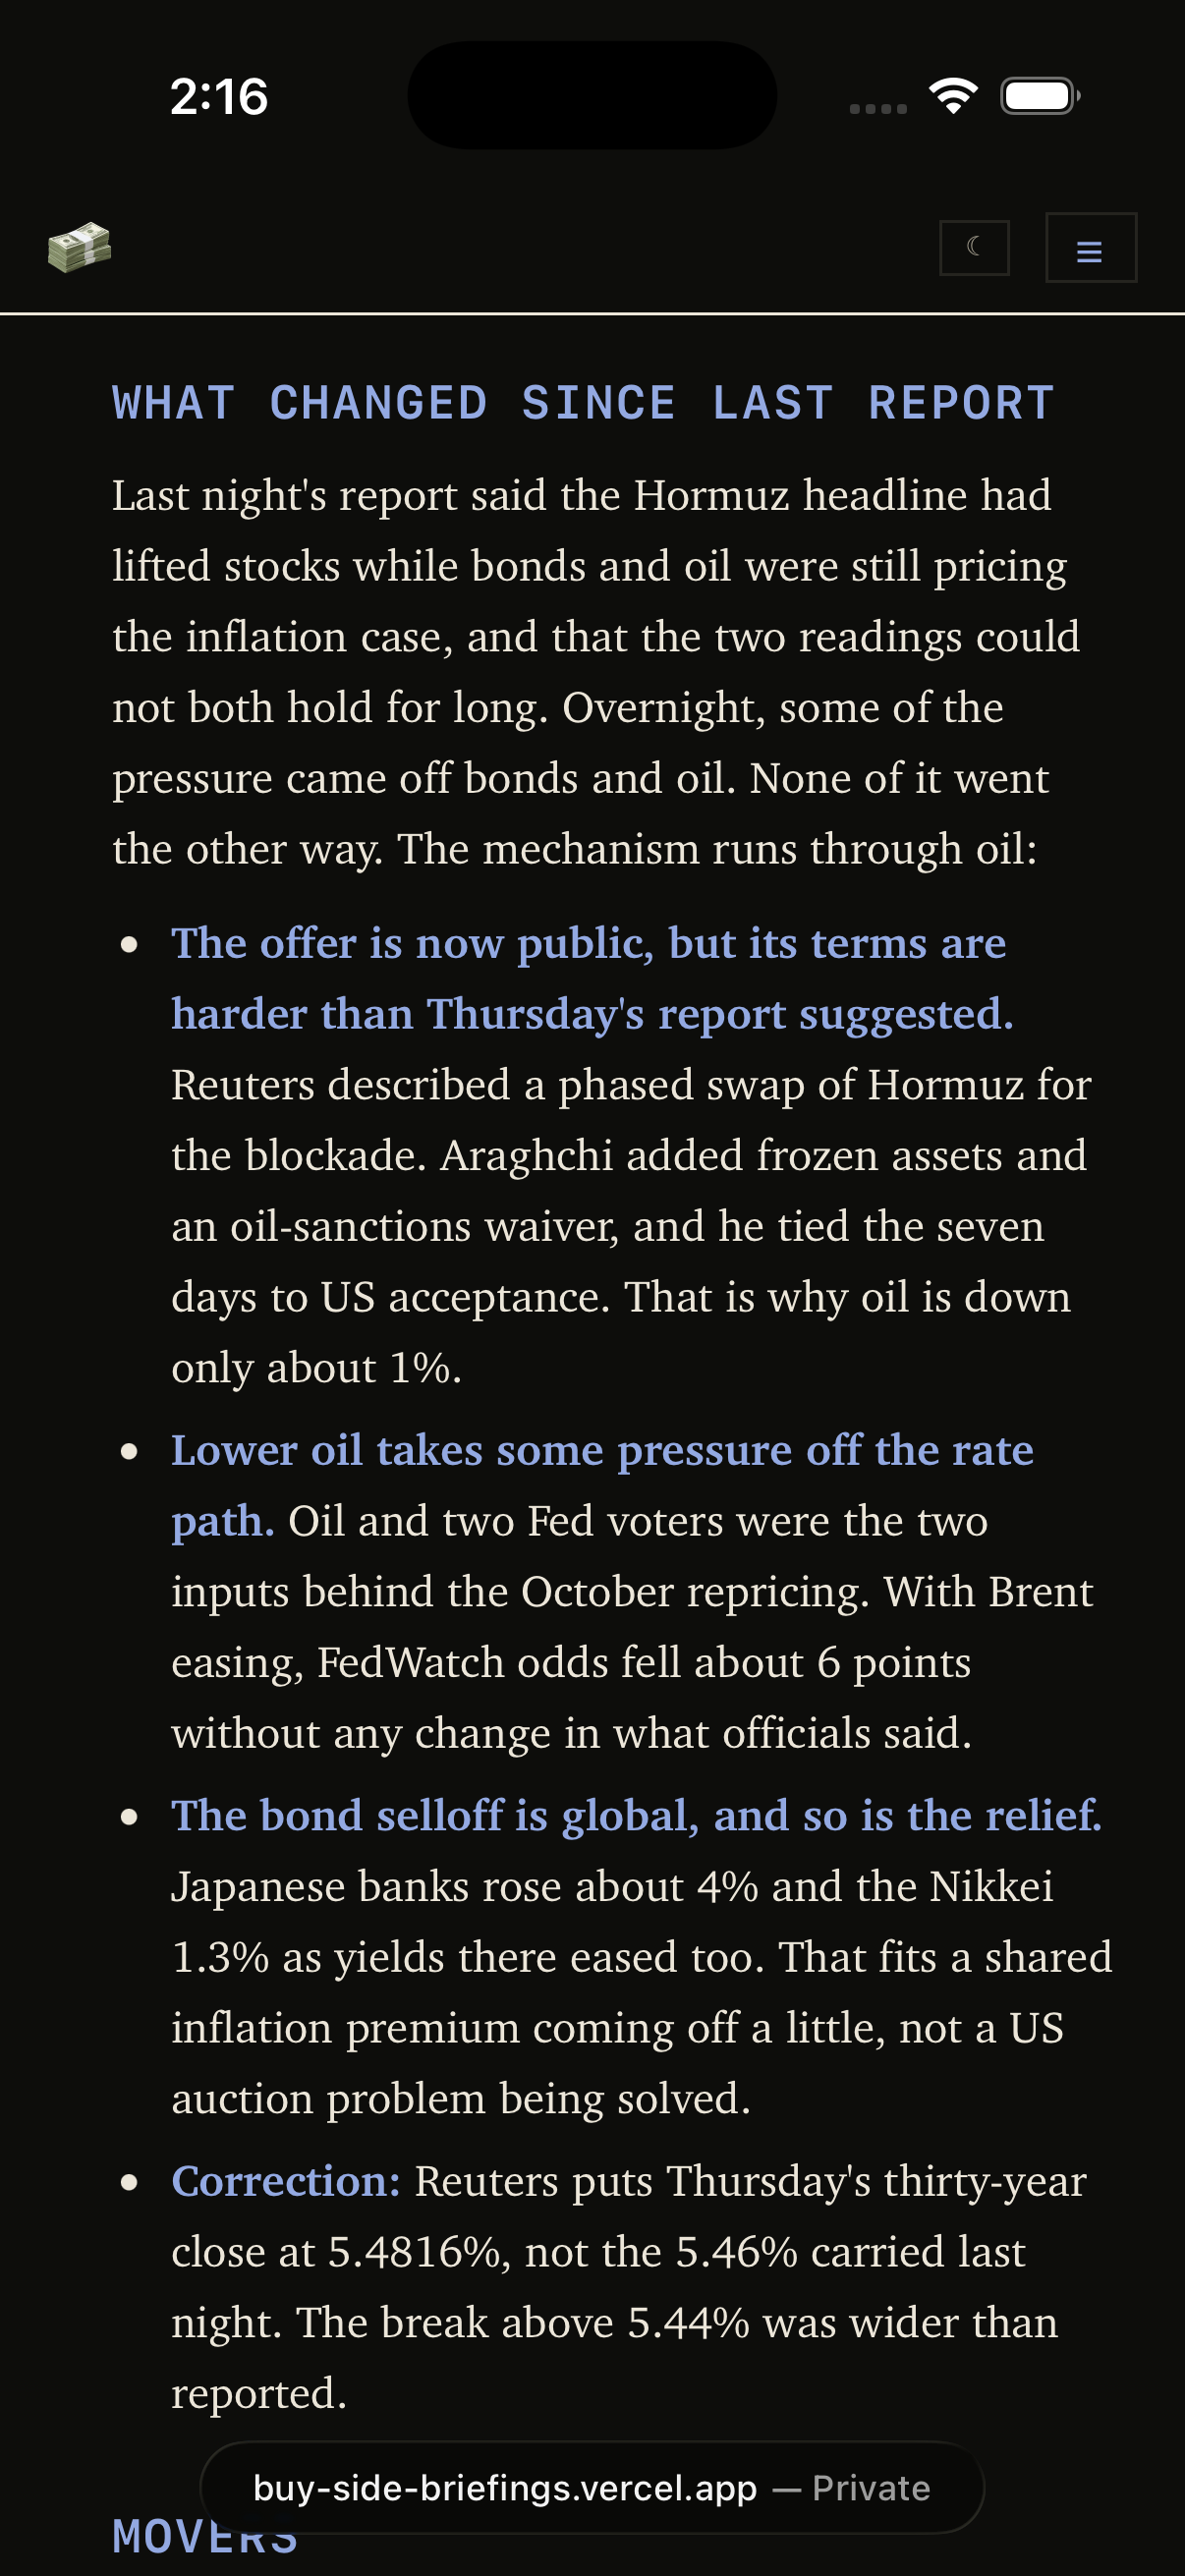
Because LLMs don't have long-term memory, the agent calibrates itself by reading reports from the last few days before writing. The historical data simulates continuity and allows the report to distinguish between ongoing and new market trends.
Designing a Pre-Market vs. After-Hours Workflow
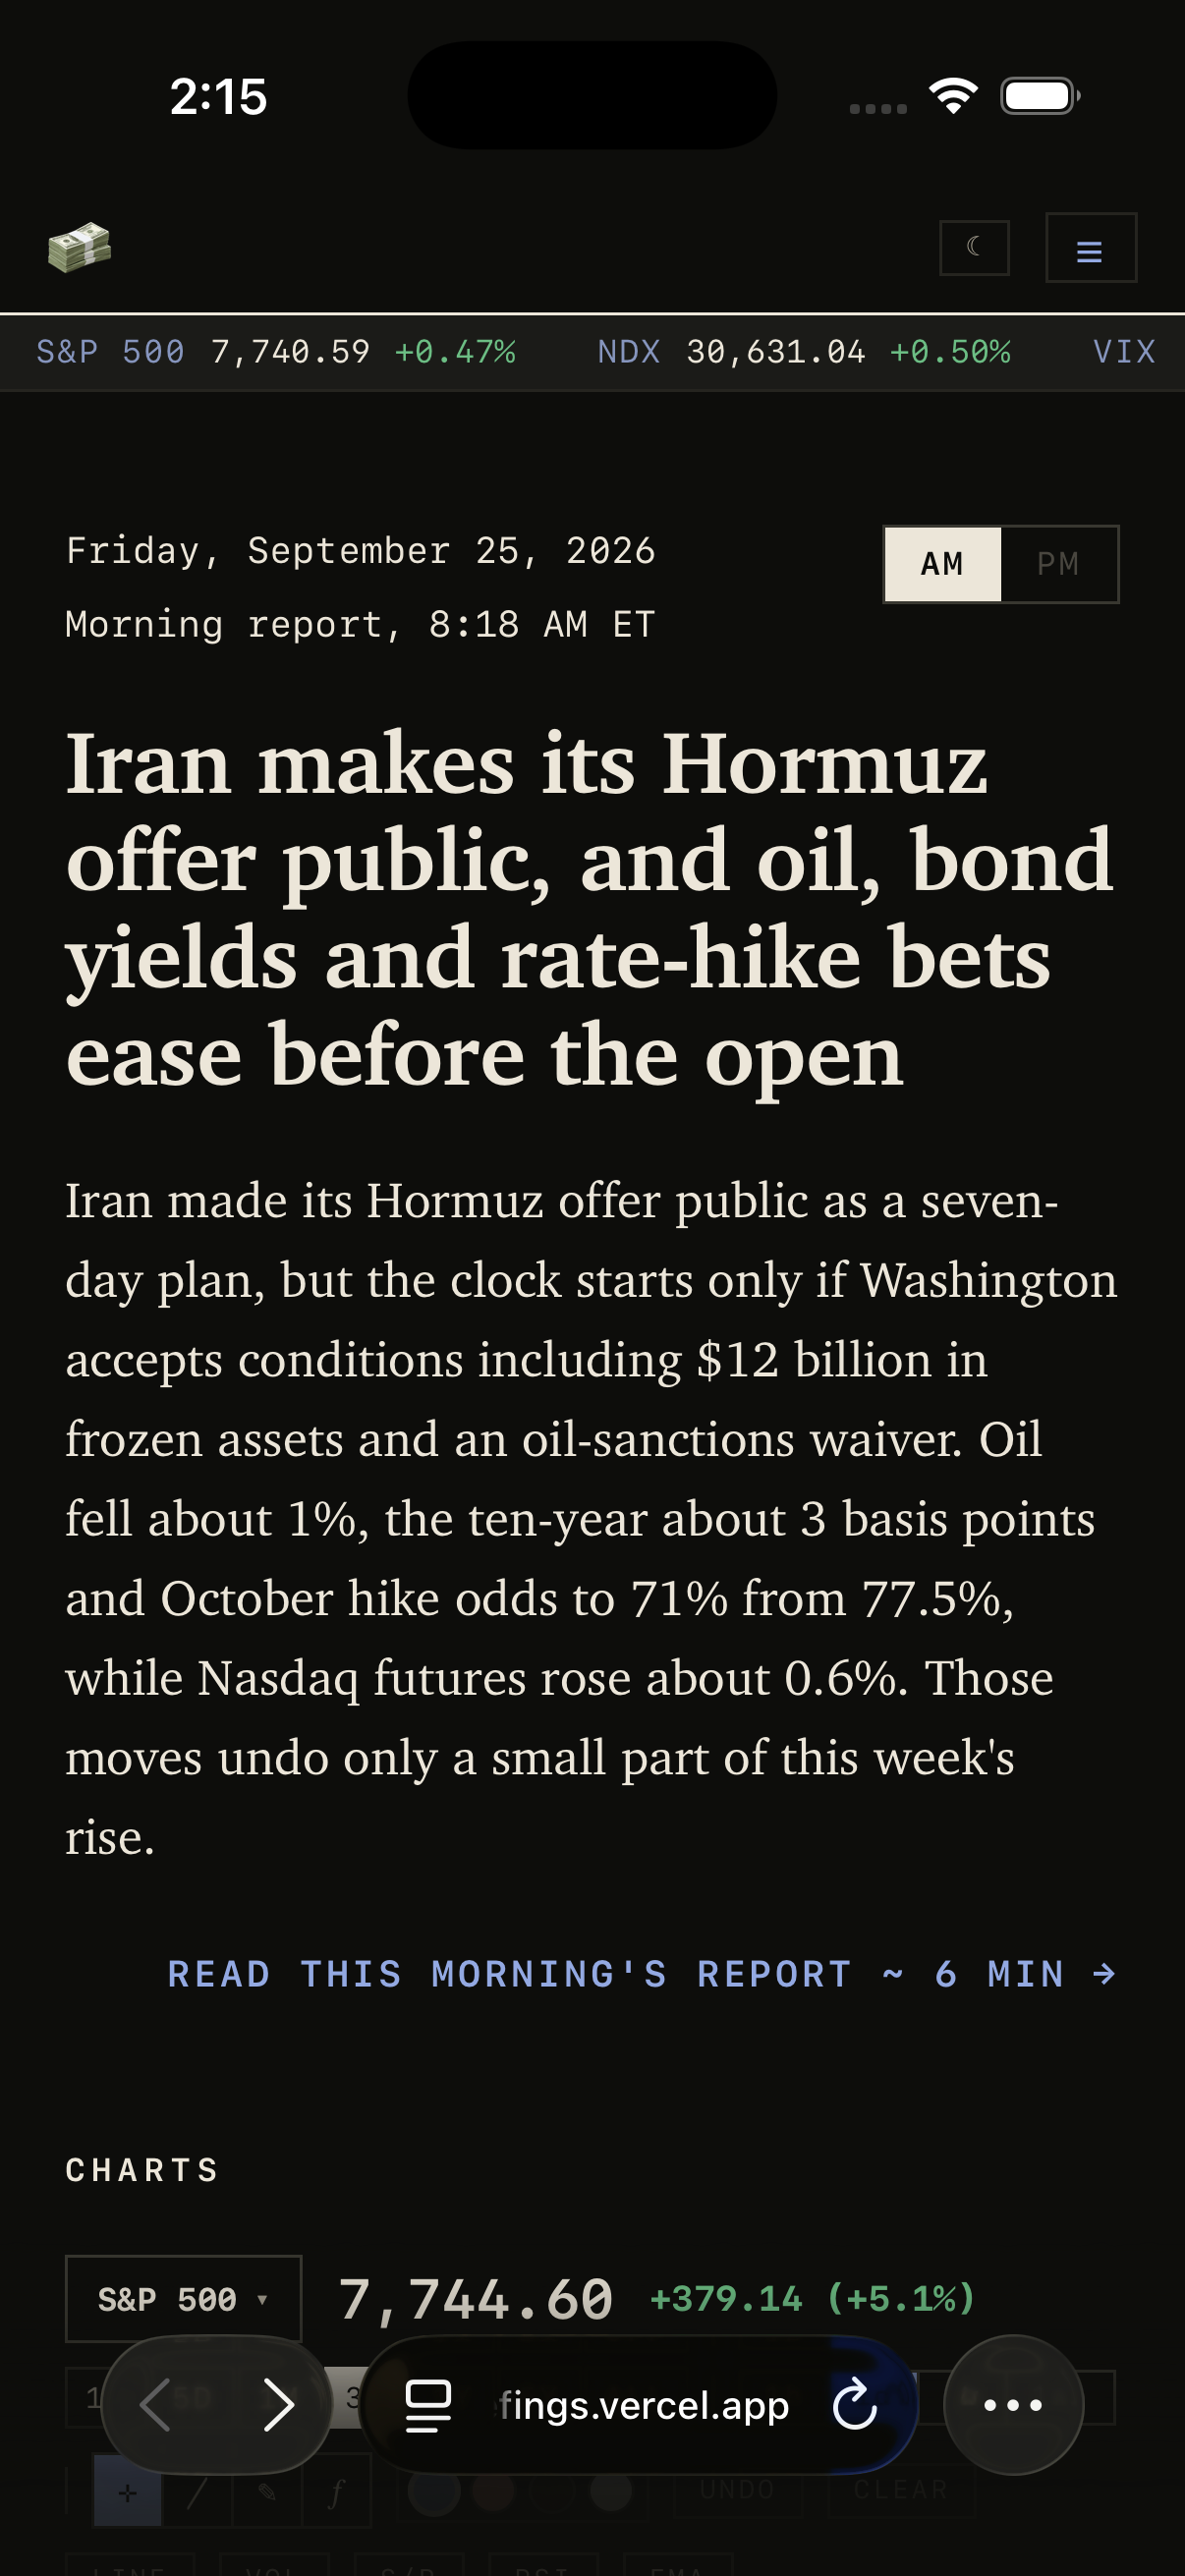
An investor's mental state changes fundamentally depending on the time of day. The morning report is forward-looking and focuses on preparation before the market opens. The night report is analytical and reflects on the day's performance.
I added an AM/PM toggle to visually accommodate different mental states. Switching to another report restructures the page with the right information.
Data Visualization
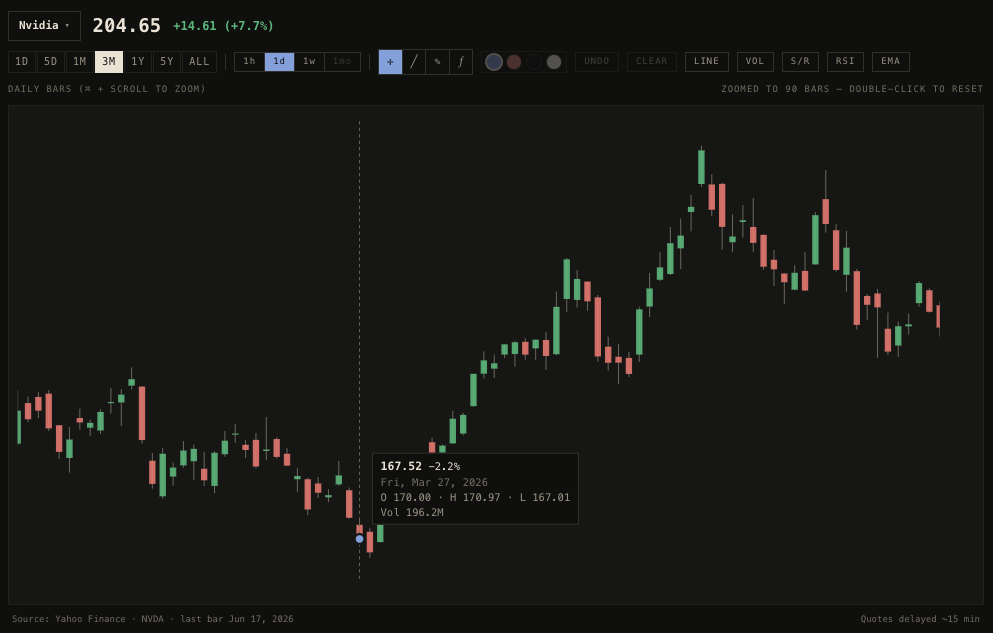
I used market data from Yahoo Finance (delayed quotes) and FRED to visualize price action.
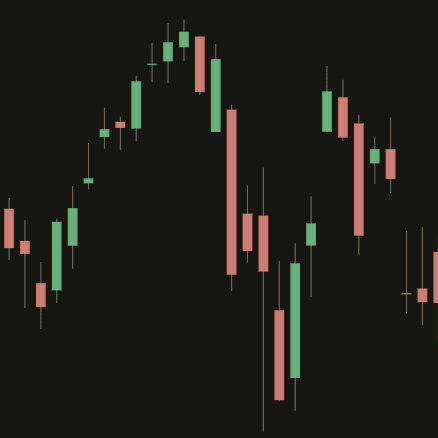
The interactive chart allows a quick inspection of tickers with candlestick ranges and some technical tools like volume, RSI, EMA, support/resistance, and Fibonacci levels.
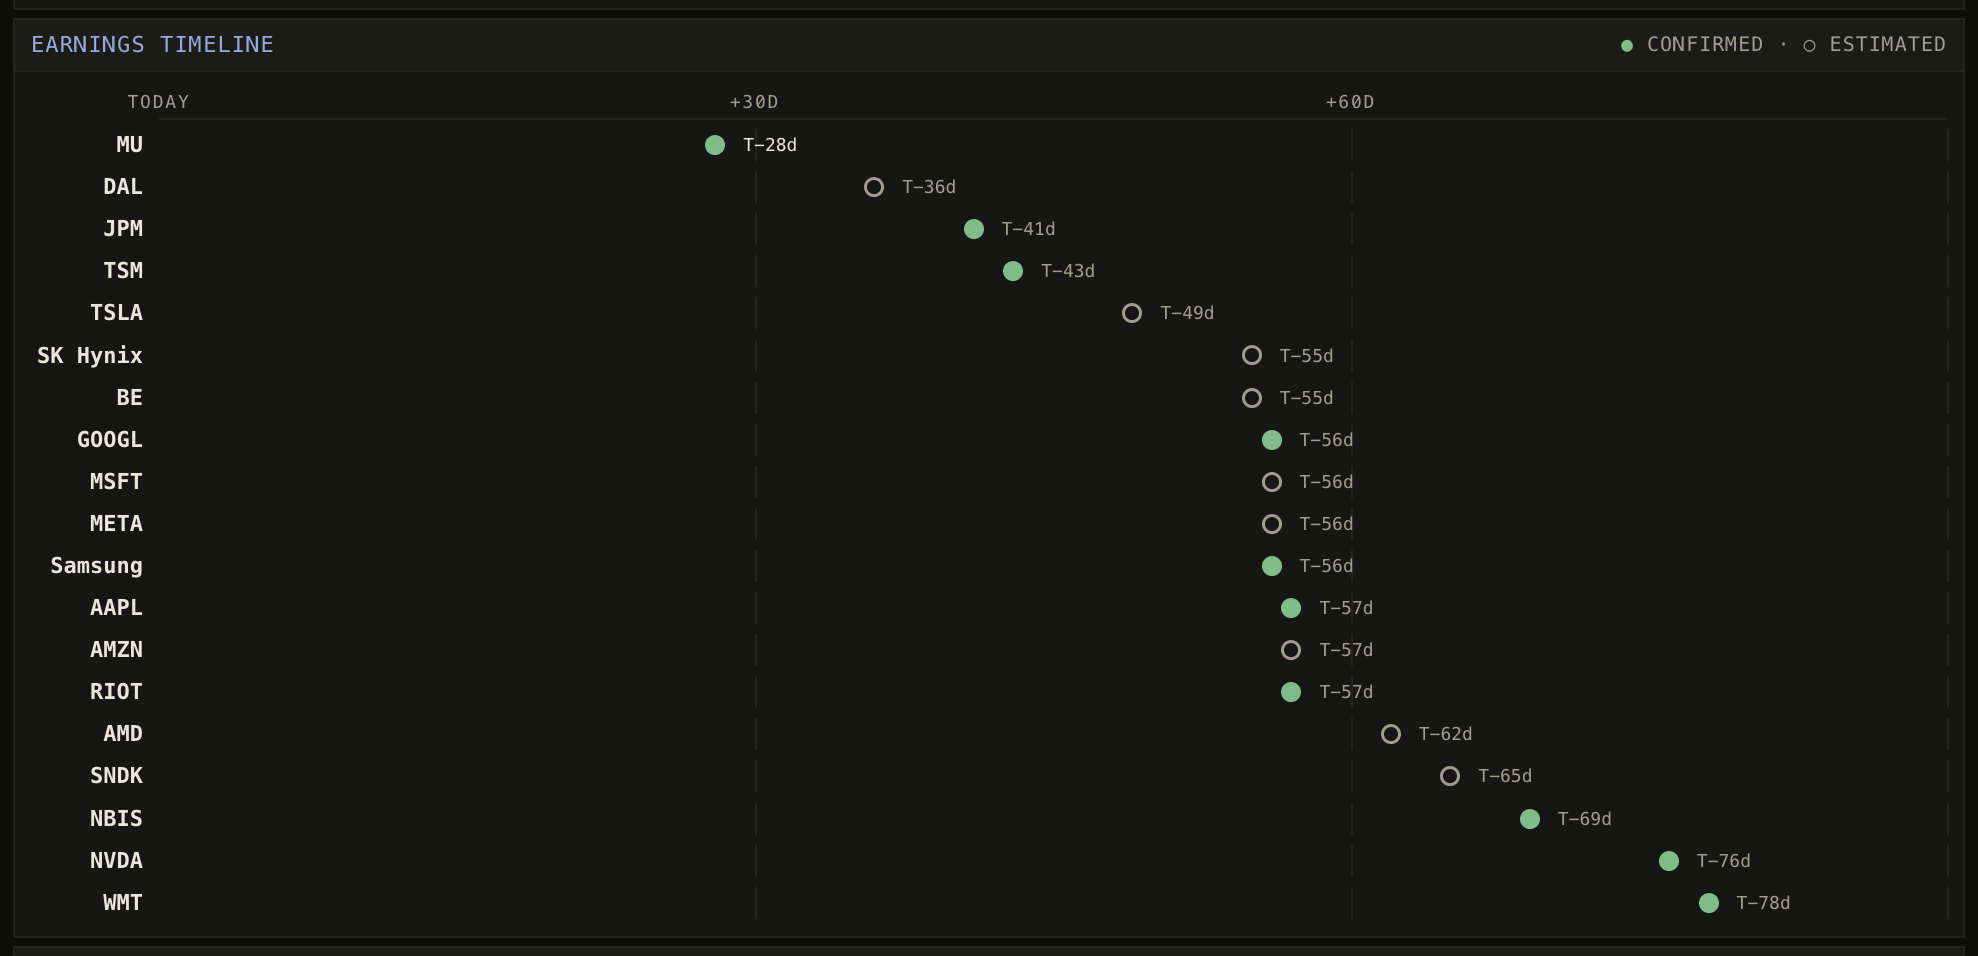
Instead of using a calendar list, I designed a timeline for upcoming earnings calls up to 90 days out. Solid dots represent confirmed dates, and hollow dots represent unconfirmed ones.
Mobile UI Design
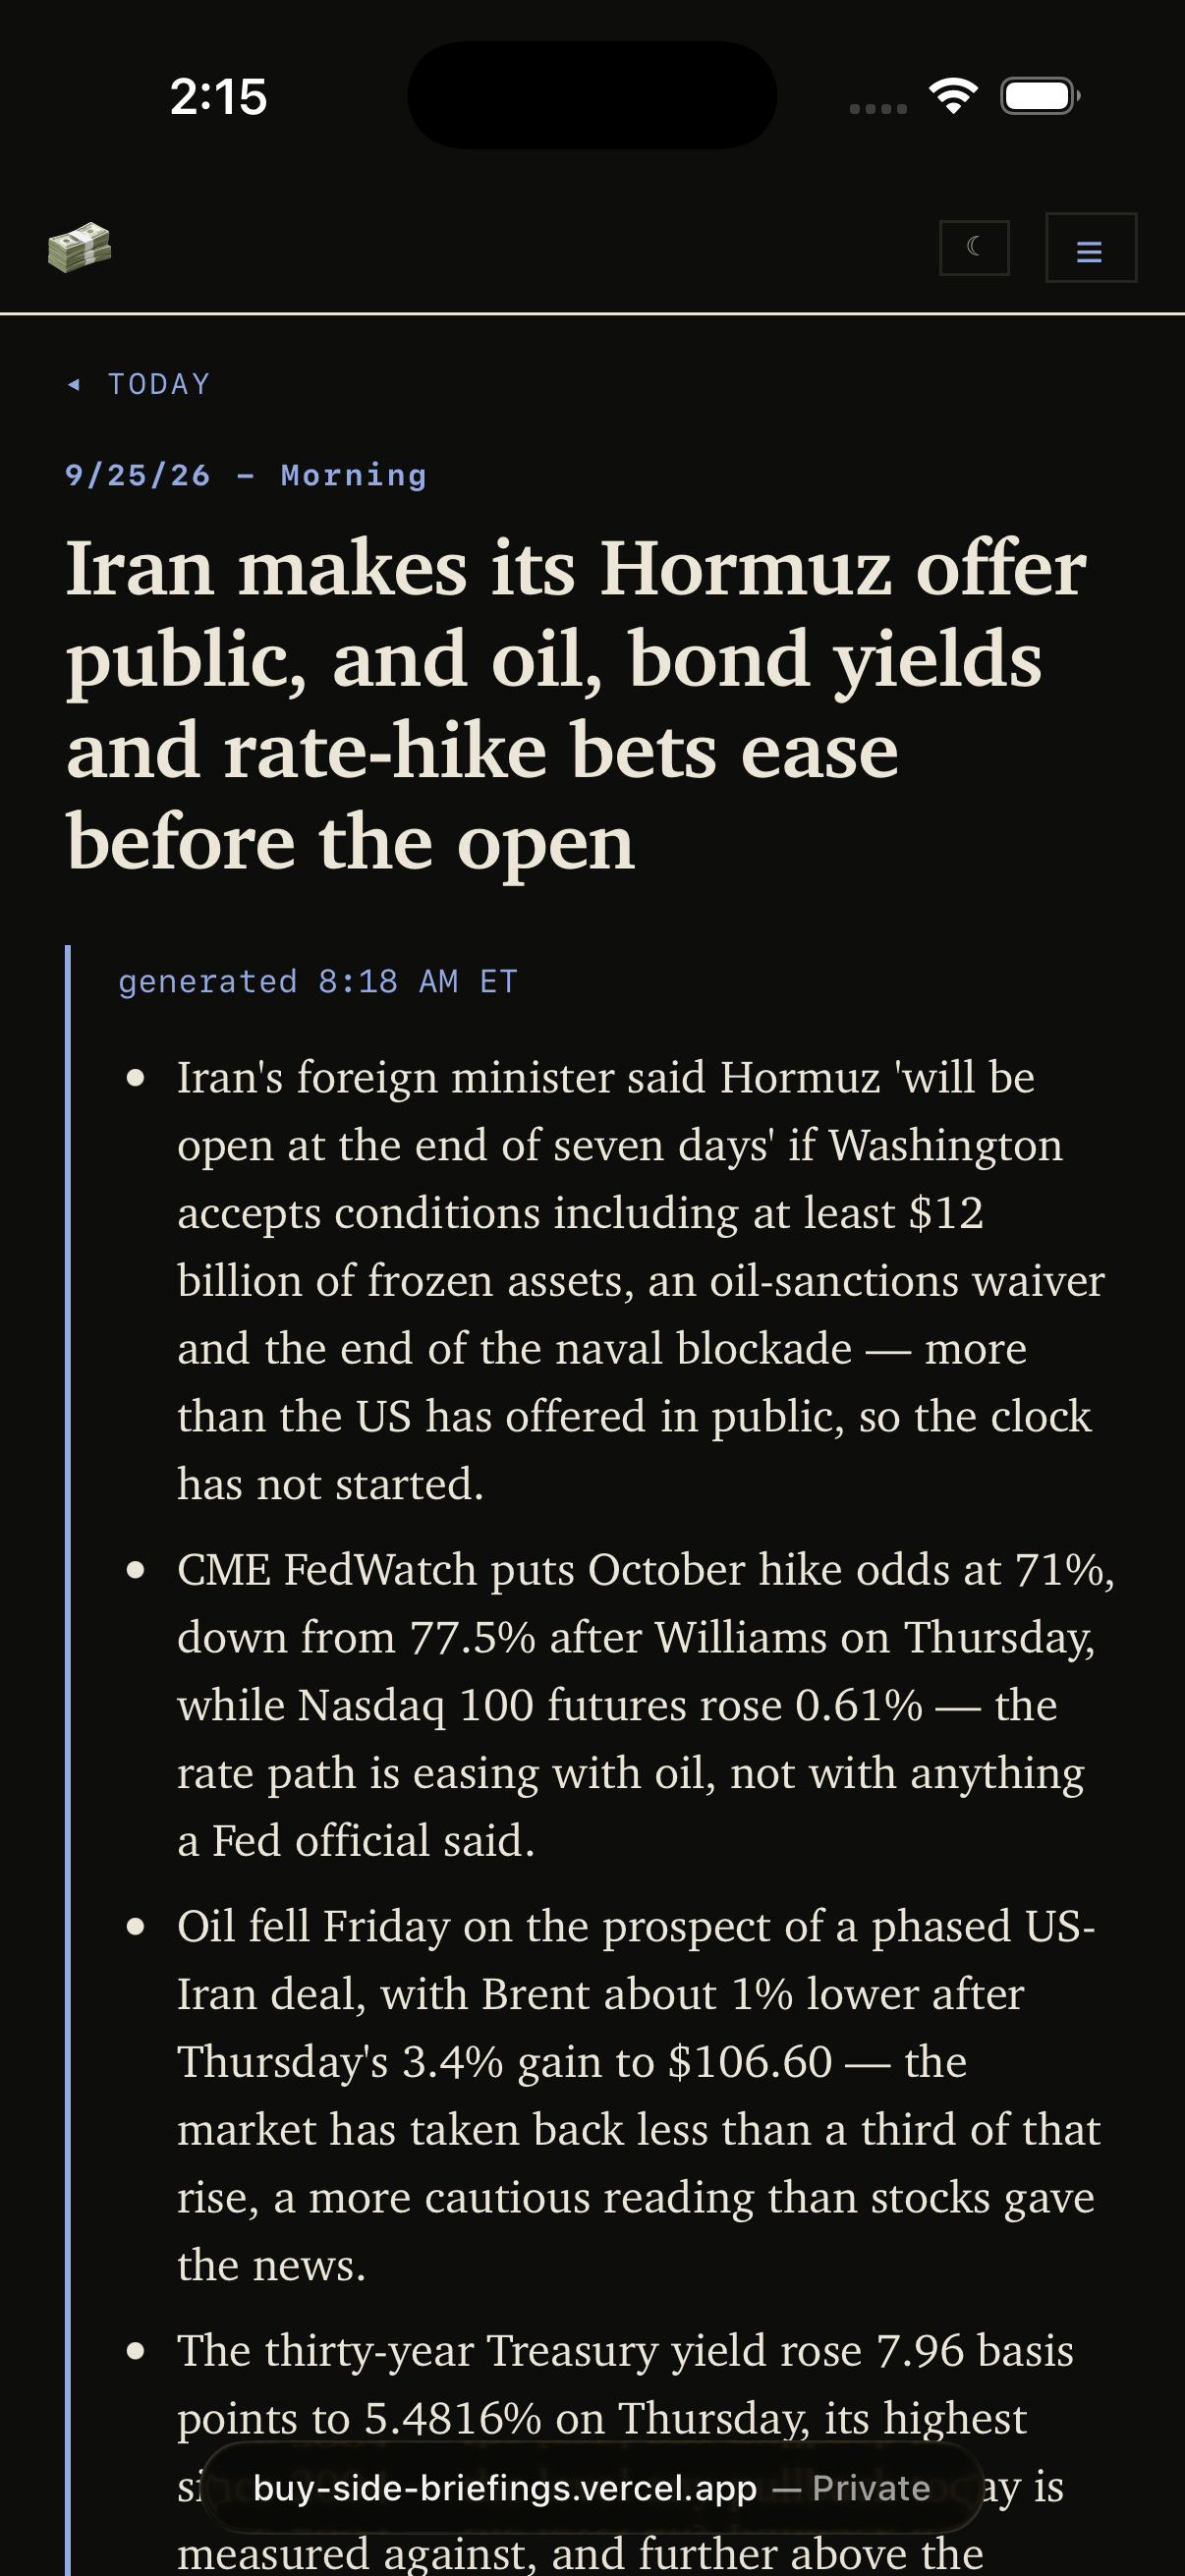
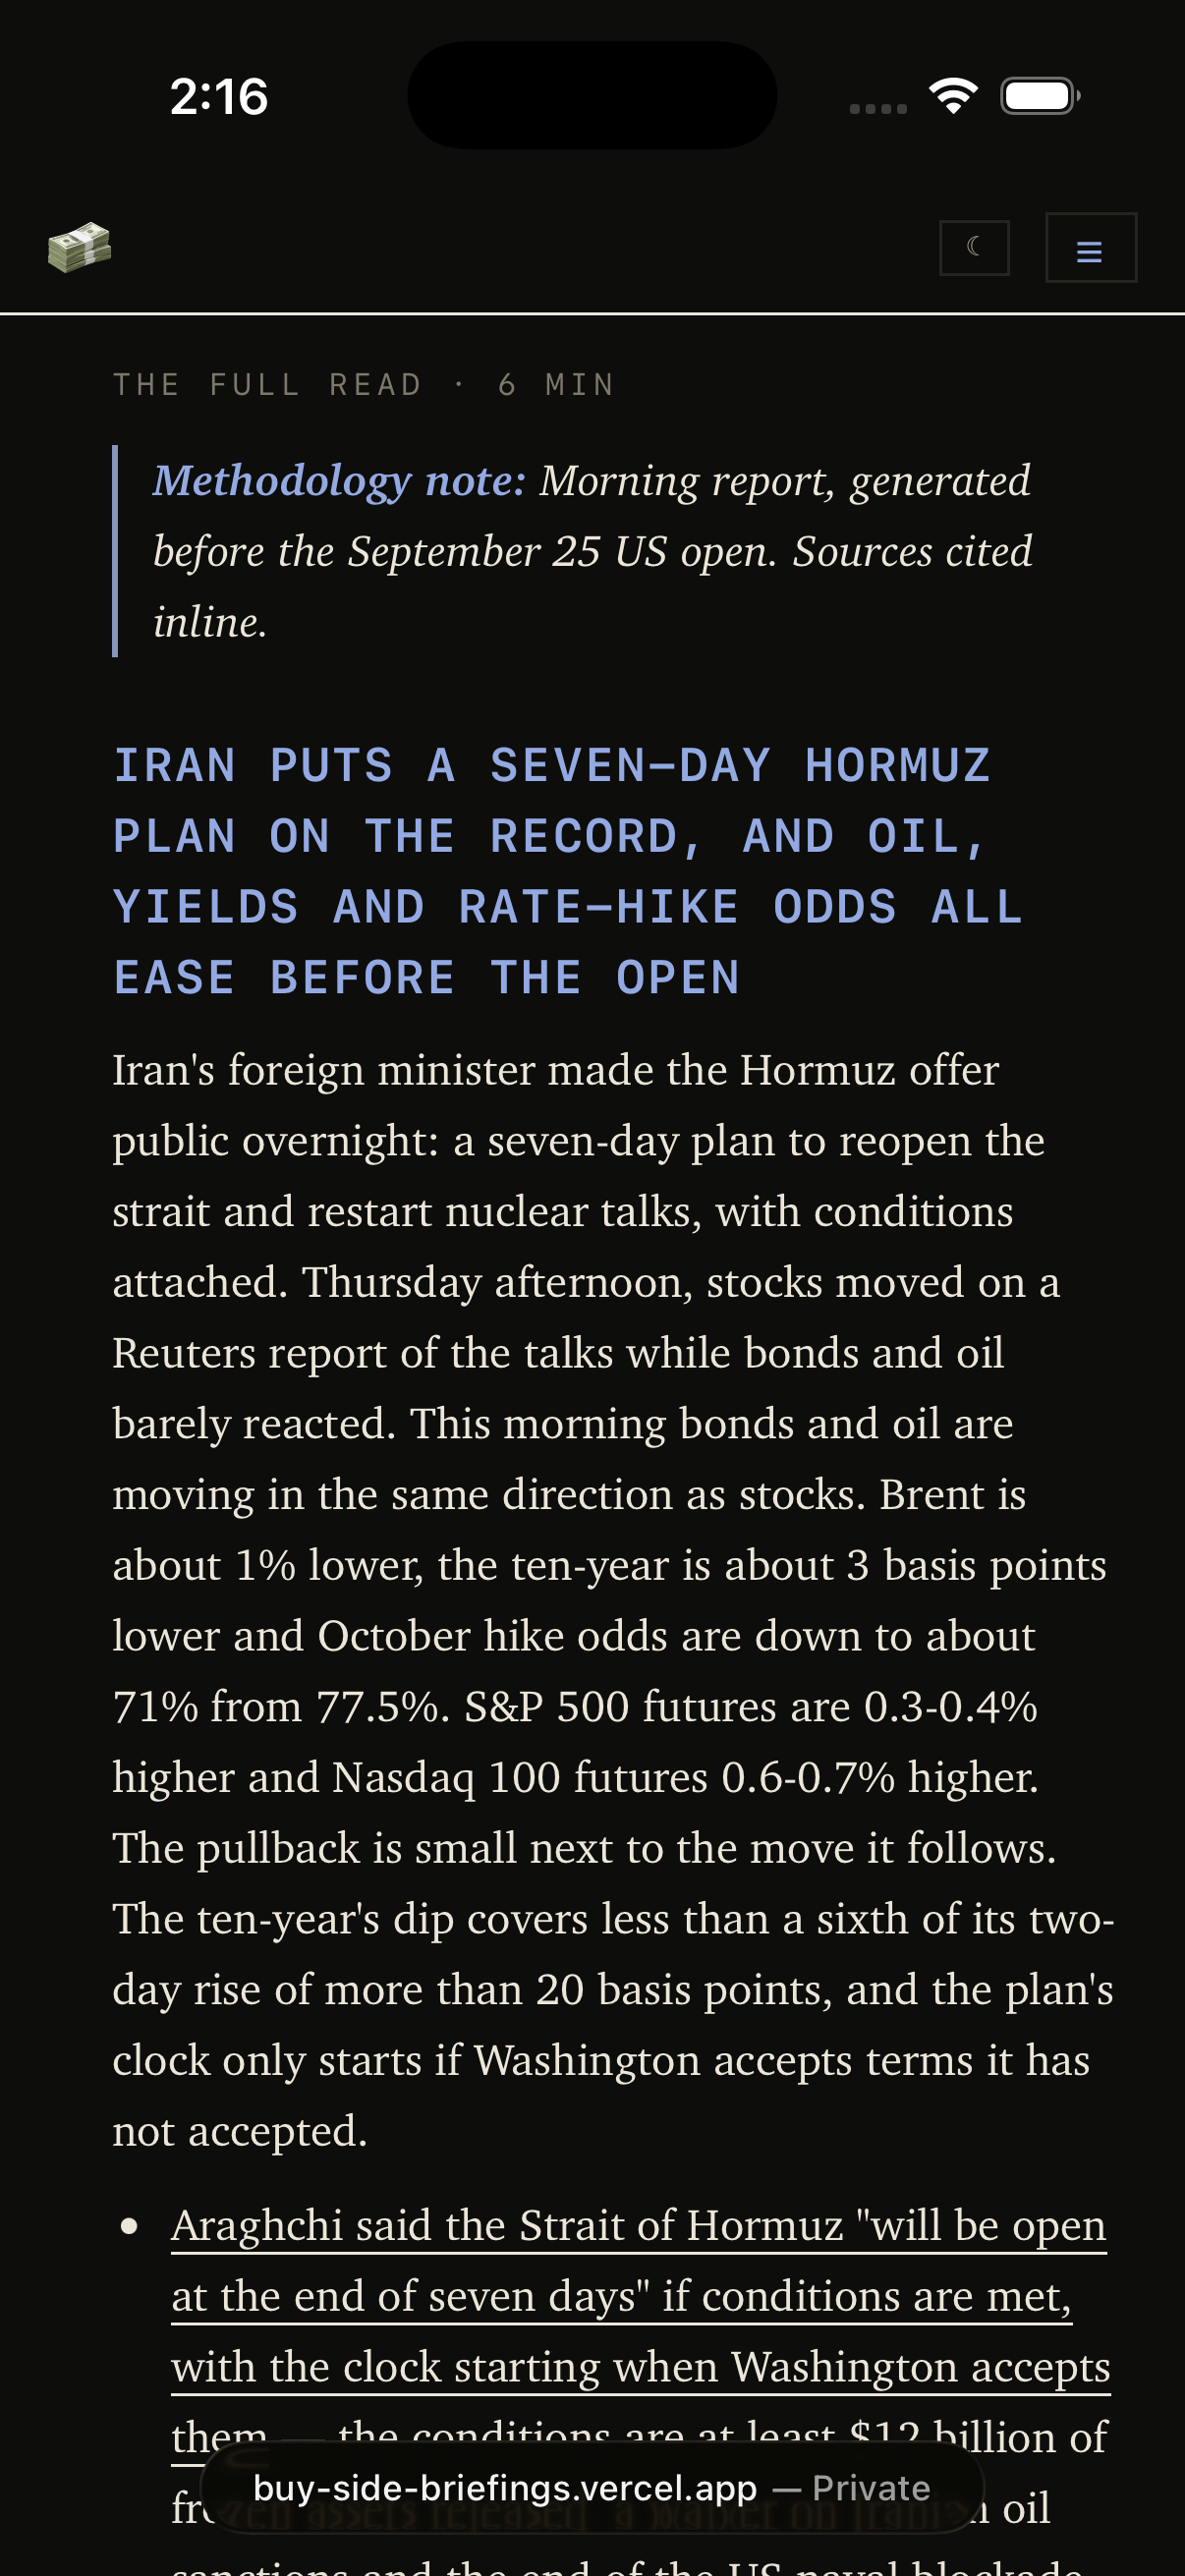
The mobile design keeps the same style as the desktop interface with a few small changes. The headline description is more concise, and all other pages live in a menu button.
Results
This project has changed many times since the start. Initially I used AI to predict the market and send me buy/sell signals based on its research, but I realized that a strictly informational website would help me more. Buy Side used to display a lot more data when I was learning the market, but I cut it down to the most important resources.
Since the website keeps a record of previous reports, it would be interesting to use that data to find sentiment trends. I plan to keep improving the reports and add features I find useful.