Buy Side

A morning report prepares you for market open and a night report reviews the day. Buy Side started as a crypto bot on Discord and turned into a market intelligence platform that helps retail investors understand current events.

Keywords: Web, Pre-Seed Startup, Finance, 0 to 1

Role: Founding Product Designer

Date: May 2026 - Present
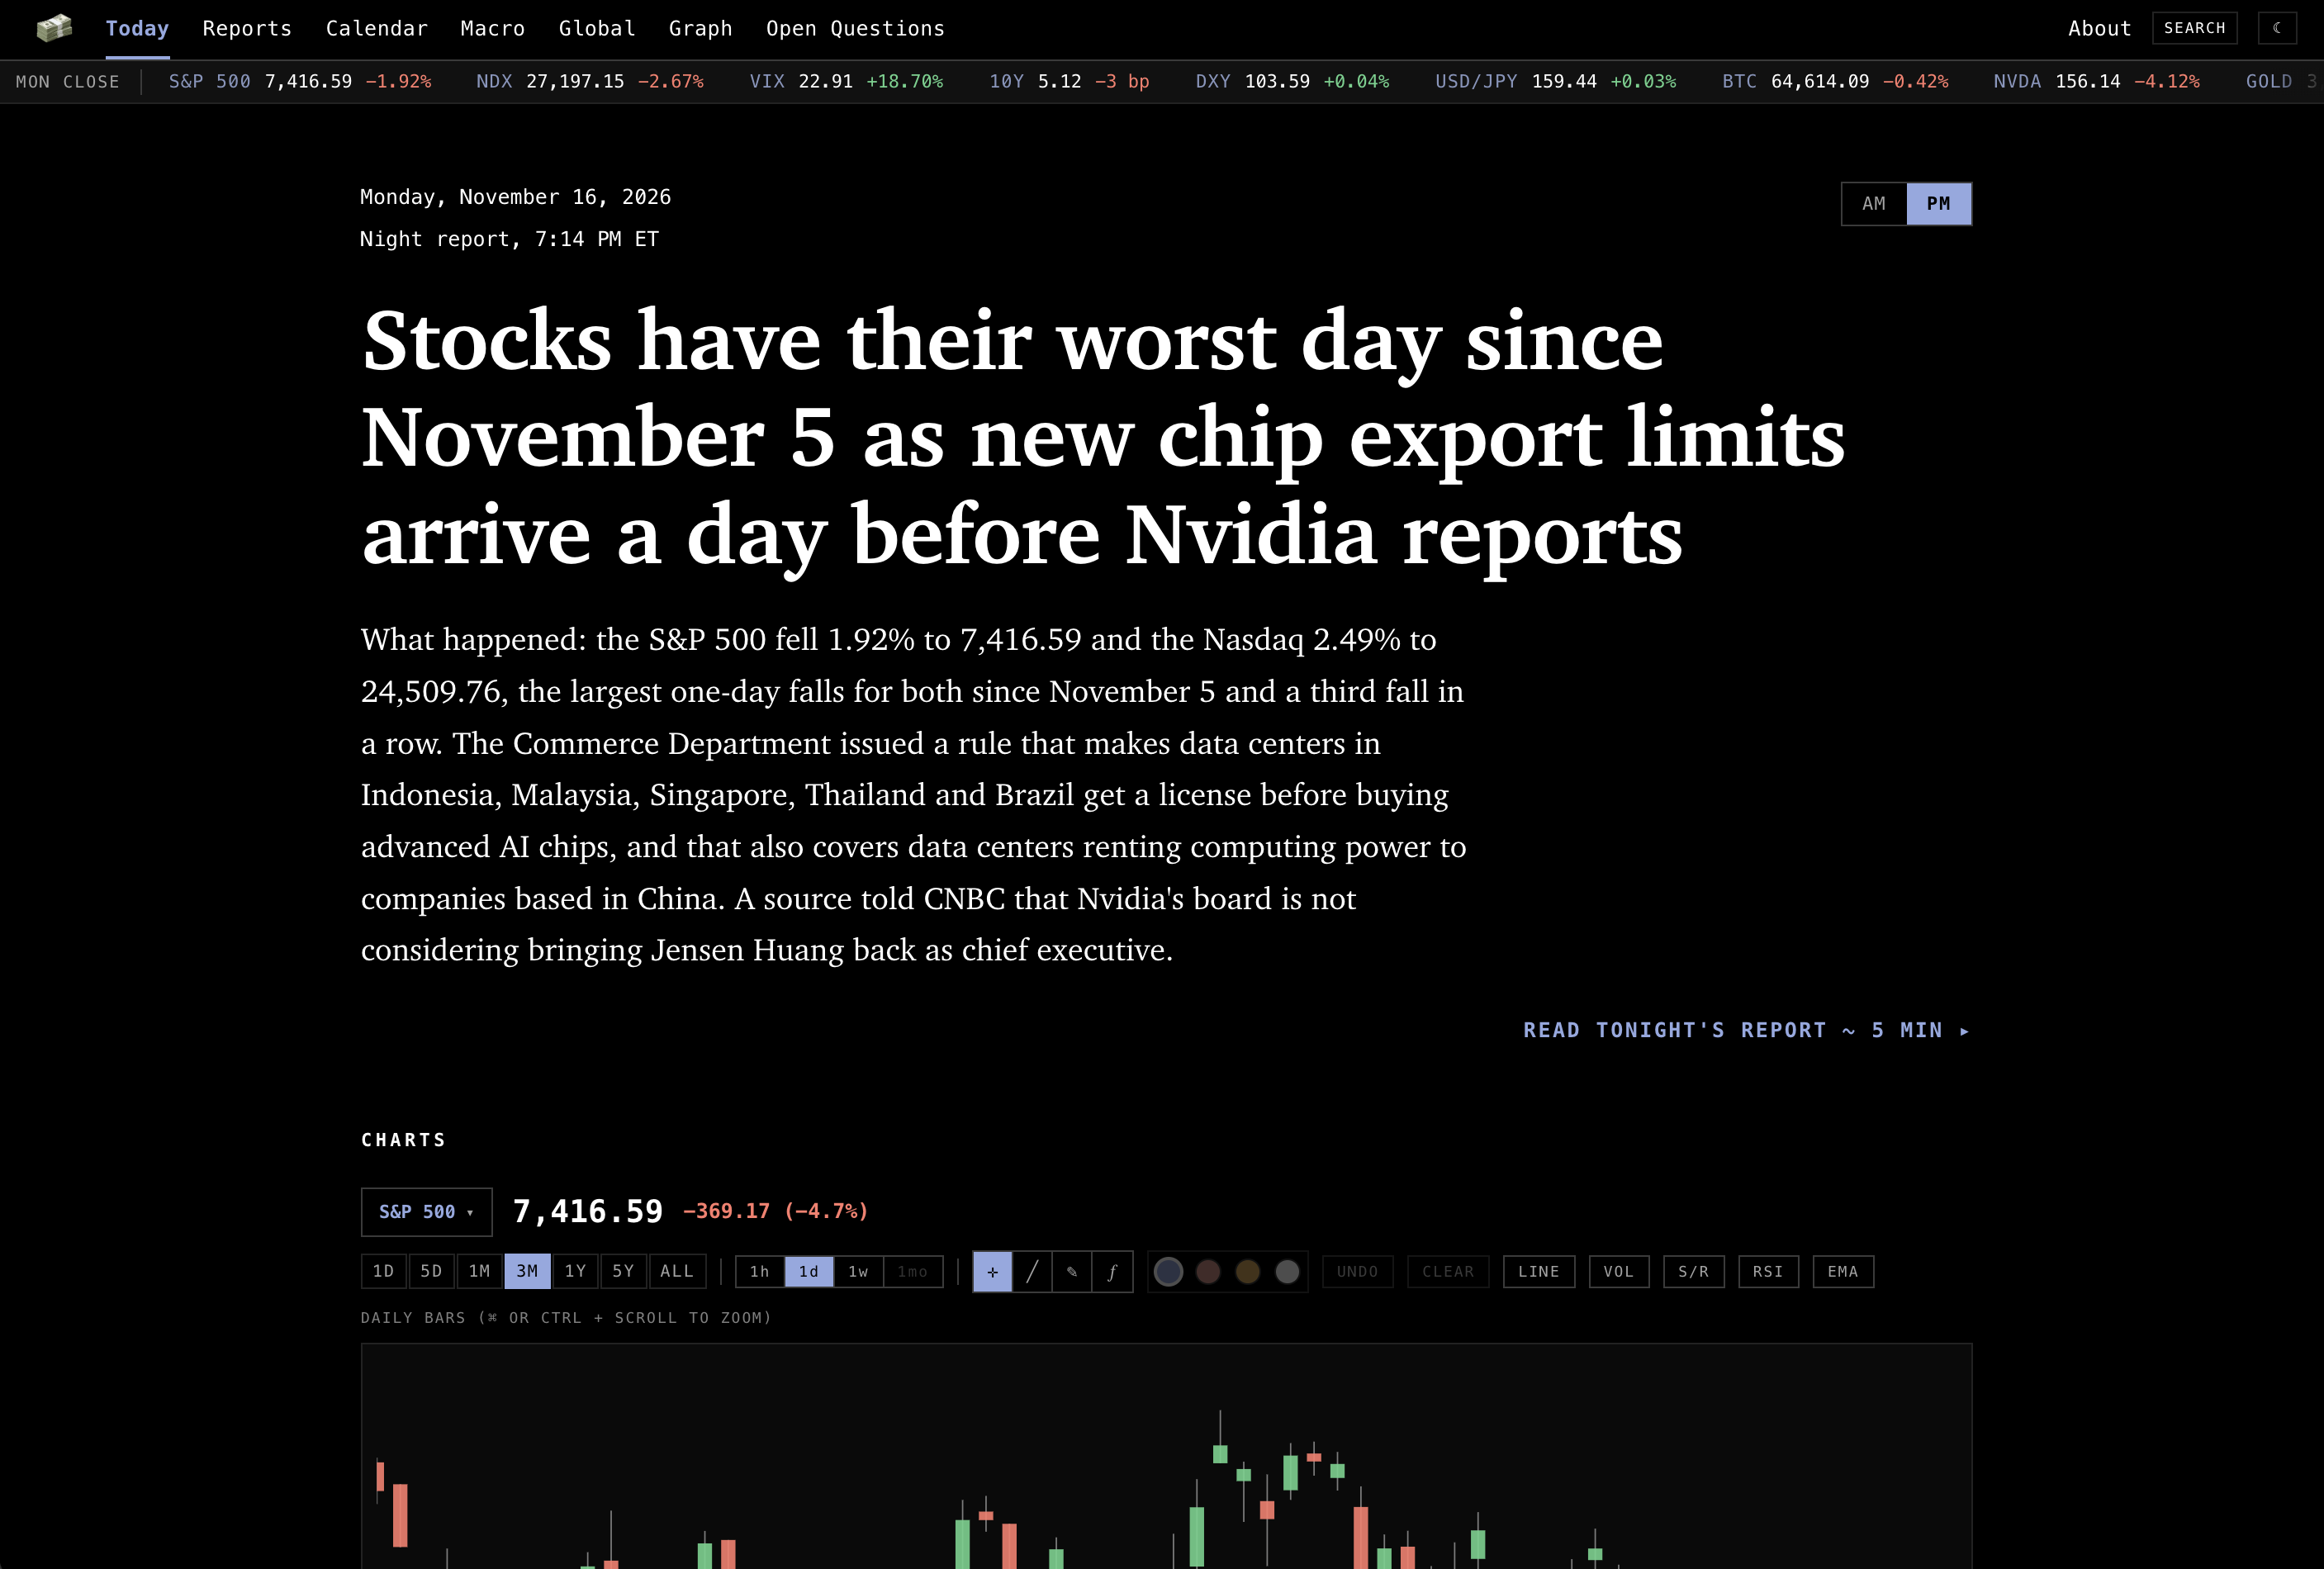
Buy Side’s Today page: a night report headed "Stocks have their worst day since November 5 as new chip export limits arrive a day before Nvidia reports", a summary of what happened, and an S&P 500 candlestick chart

Problem

Understanding the stock market requires aggregating data from multiple sources and interpreting it correctly: stock exchanges, financial news outlets, SEC filings, social media, and micro/macroeconomics.

This is a complicated process that can lead to uncertainty and missed opportunities.

Solution

Our solution was a system that curates information, generates reports, and keeps a record so an investor can quickly understand current events and make faster decisions.
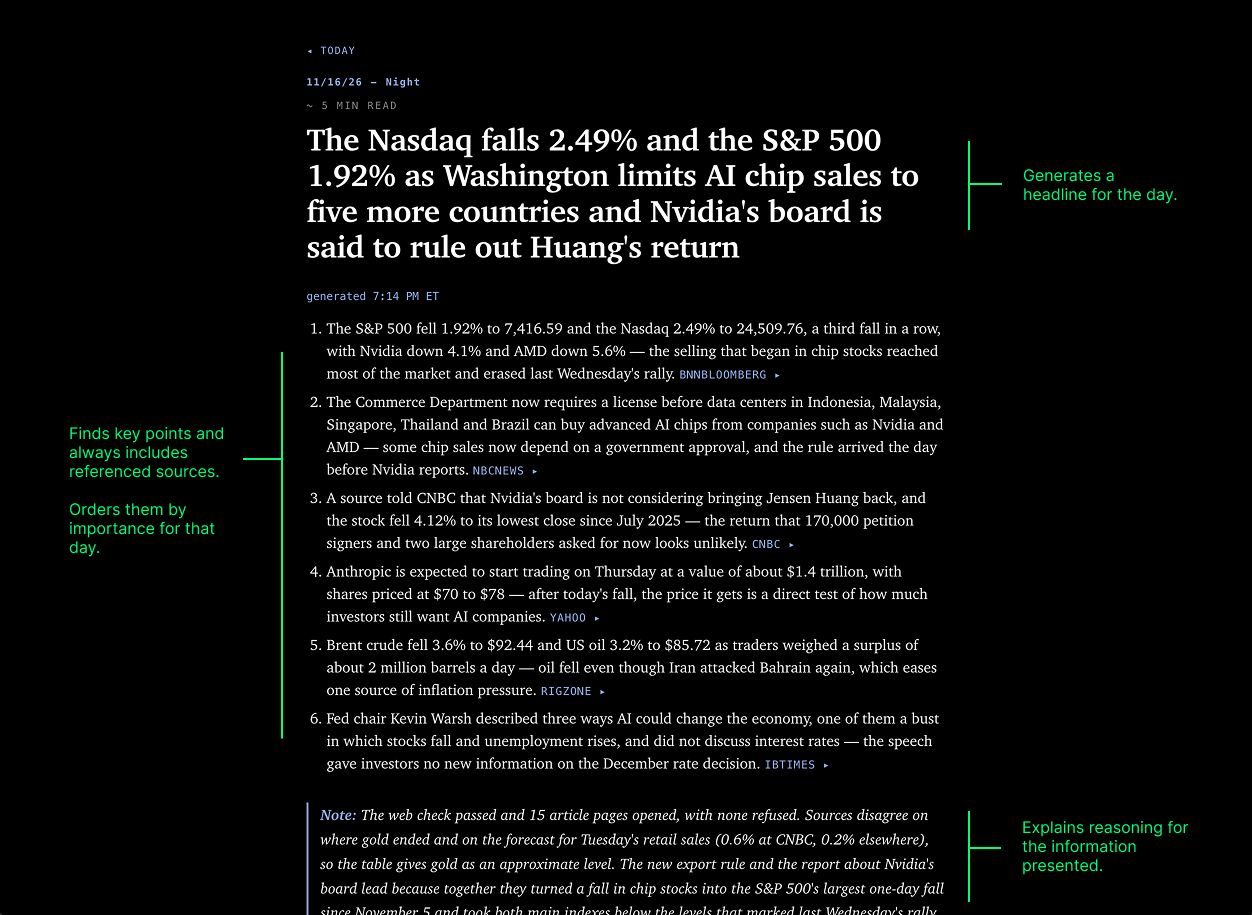
The night report of November 16, 2026, with notes. Its headline on the Nasdaq falling 2.49% and the S&P 500 1.92% as Washington limits AI chip sales to five more countries and Nvidia’s board is said to rule out Huang’s return, noted as generates a headline for the day. Six bullet points on the index falls, the Commerce Department’s chip license rule, Nvidia’s board, Anthropic’s listing, oil prices and the Fed chair’s speech, each ending in a source link, noted as finds key points and always includes referenced sources, and orders them by importance for that day. A closing note on which pages the run could open and why the export rule and the Nvidia report lead, noted as explains reasoning for the information presented.
11/16/26, PM Report

Charts and technical tools for perspective

I designed a chart that displays candlestick ranges and technical tools for trading like volume, RSI, EMA, support/resistance, and Fibonacci levels.
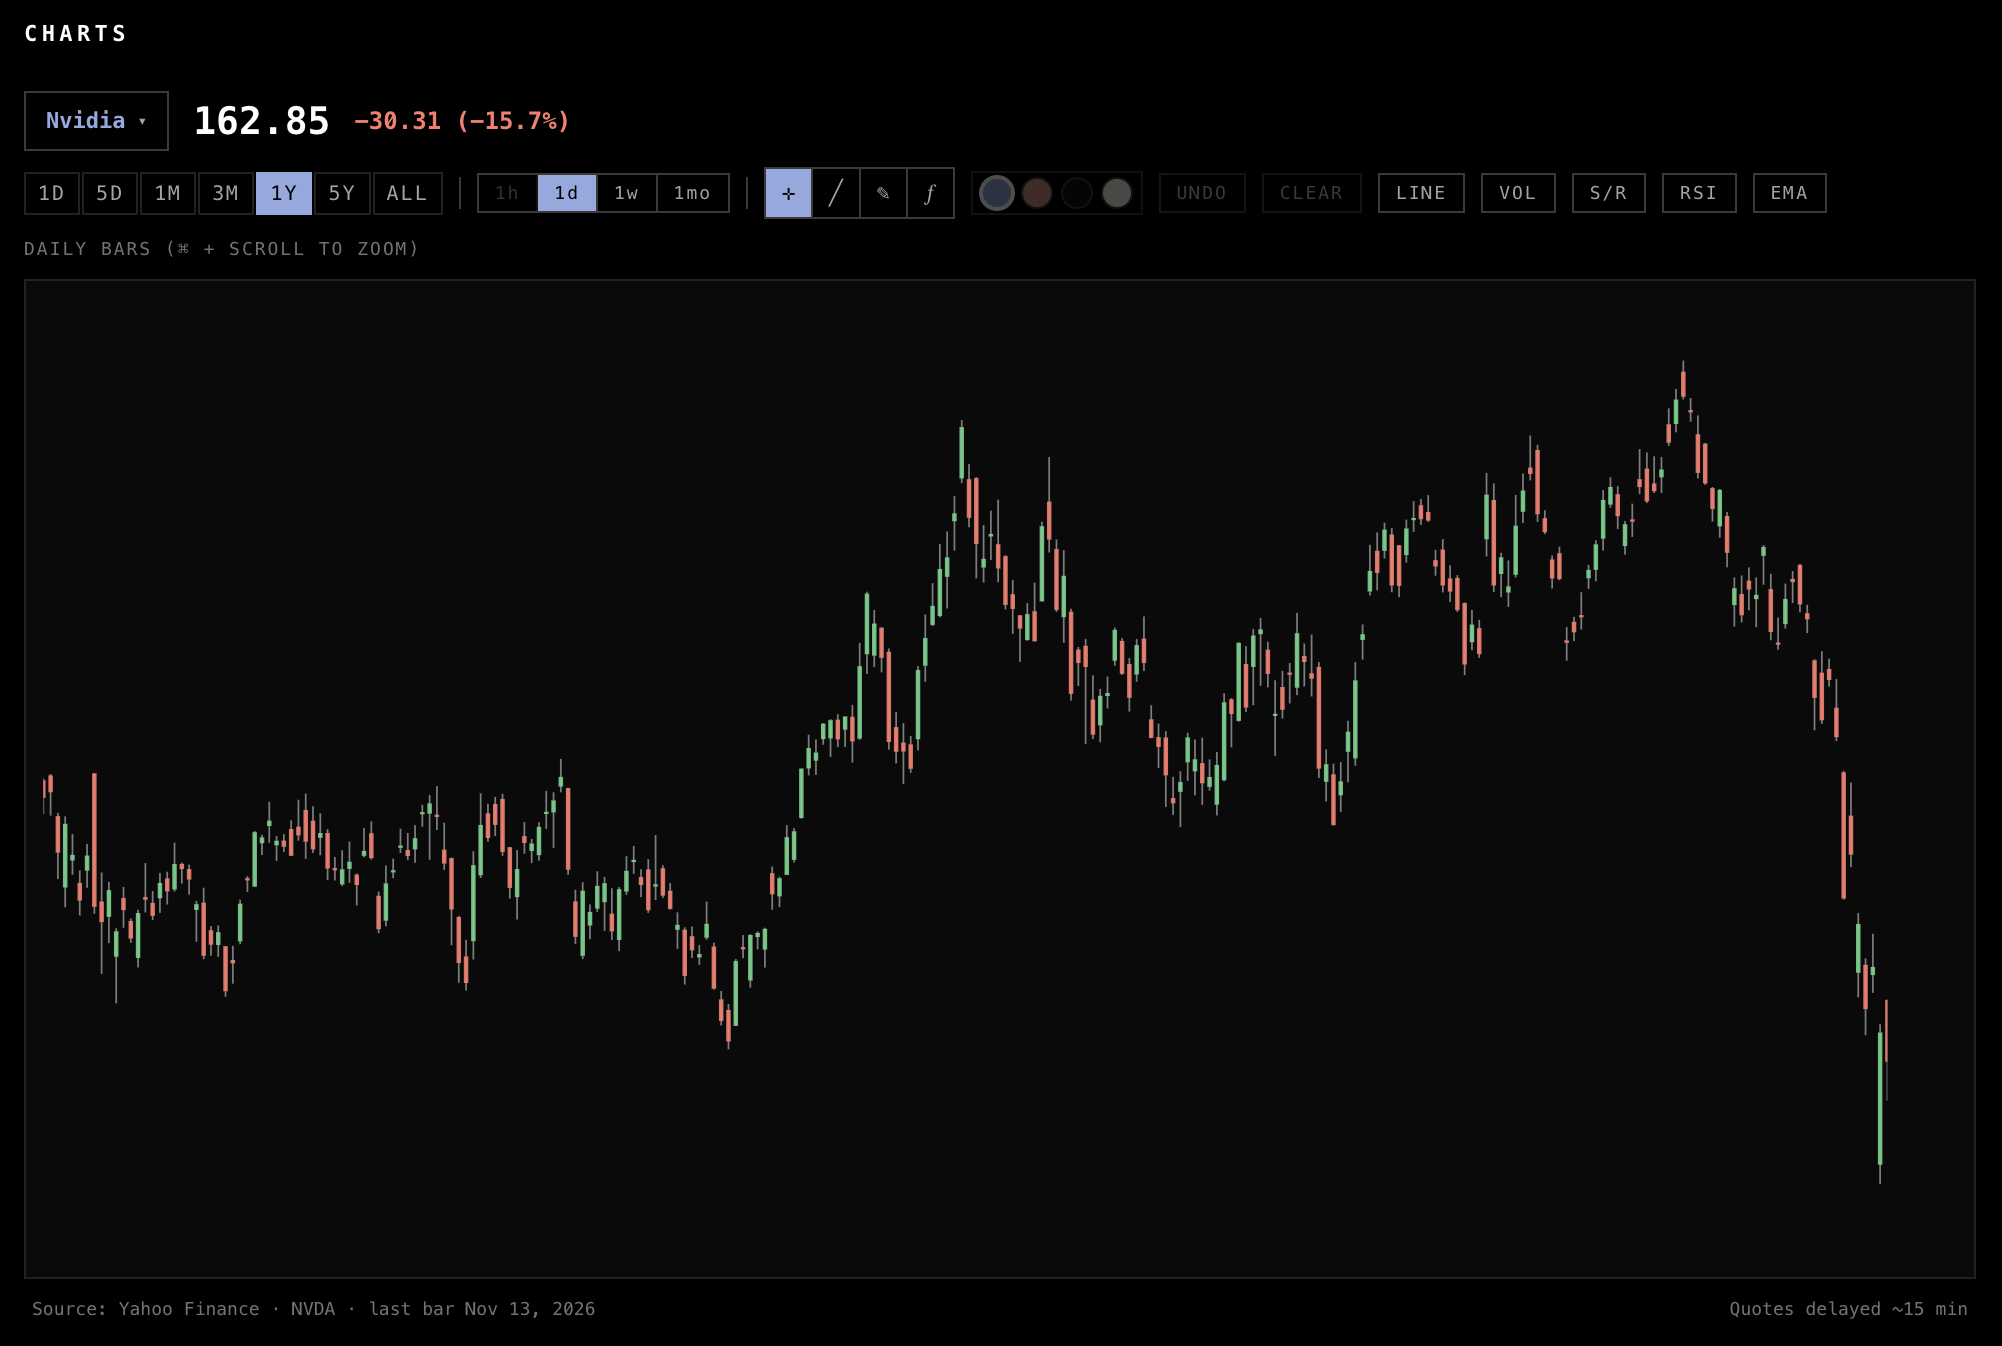
The charts panel: Nvidia selected at 162.85, down 15.7%, with range, bar and drawing controls under it, and a year of daily candlesticks that climb to a peak and then drop sharply over the last few bars, over a footer crediting Yahoo Finance with a last bar of November 13, 2026 and noting quotes are delayed about fifteen minutes

Mapping reports by sentiment, expectations, and market reaction
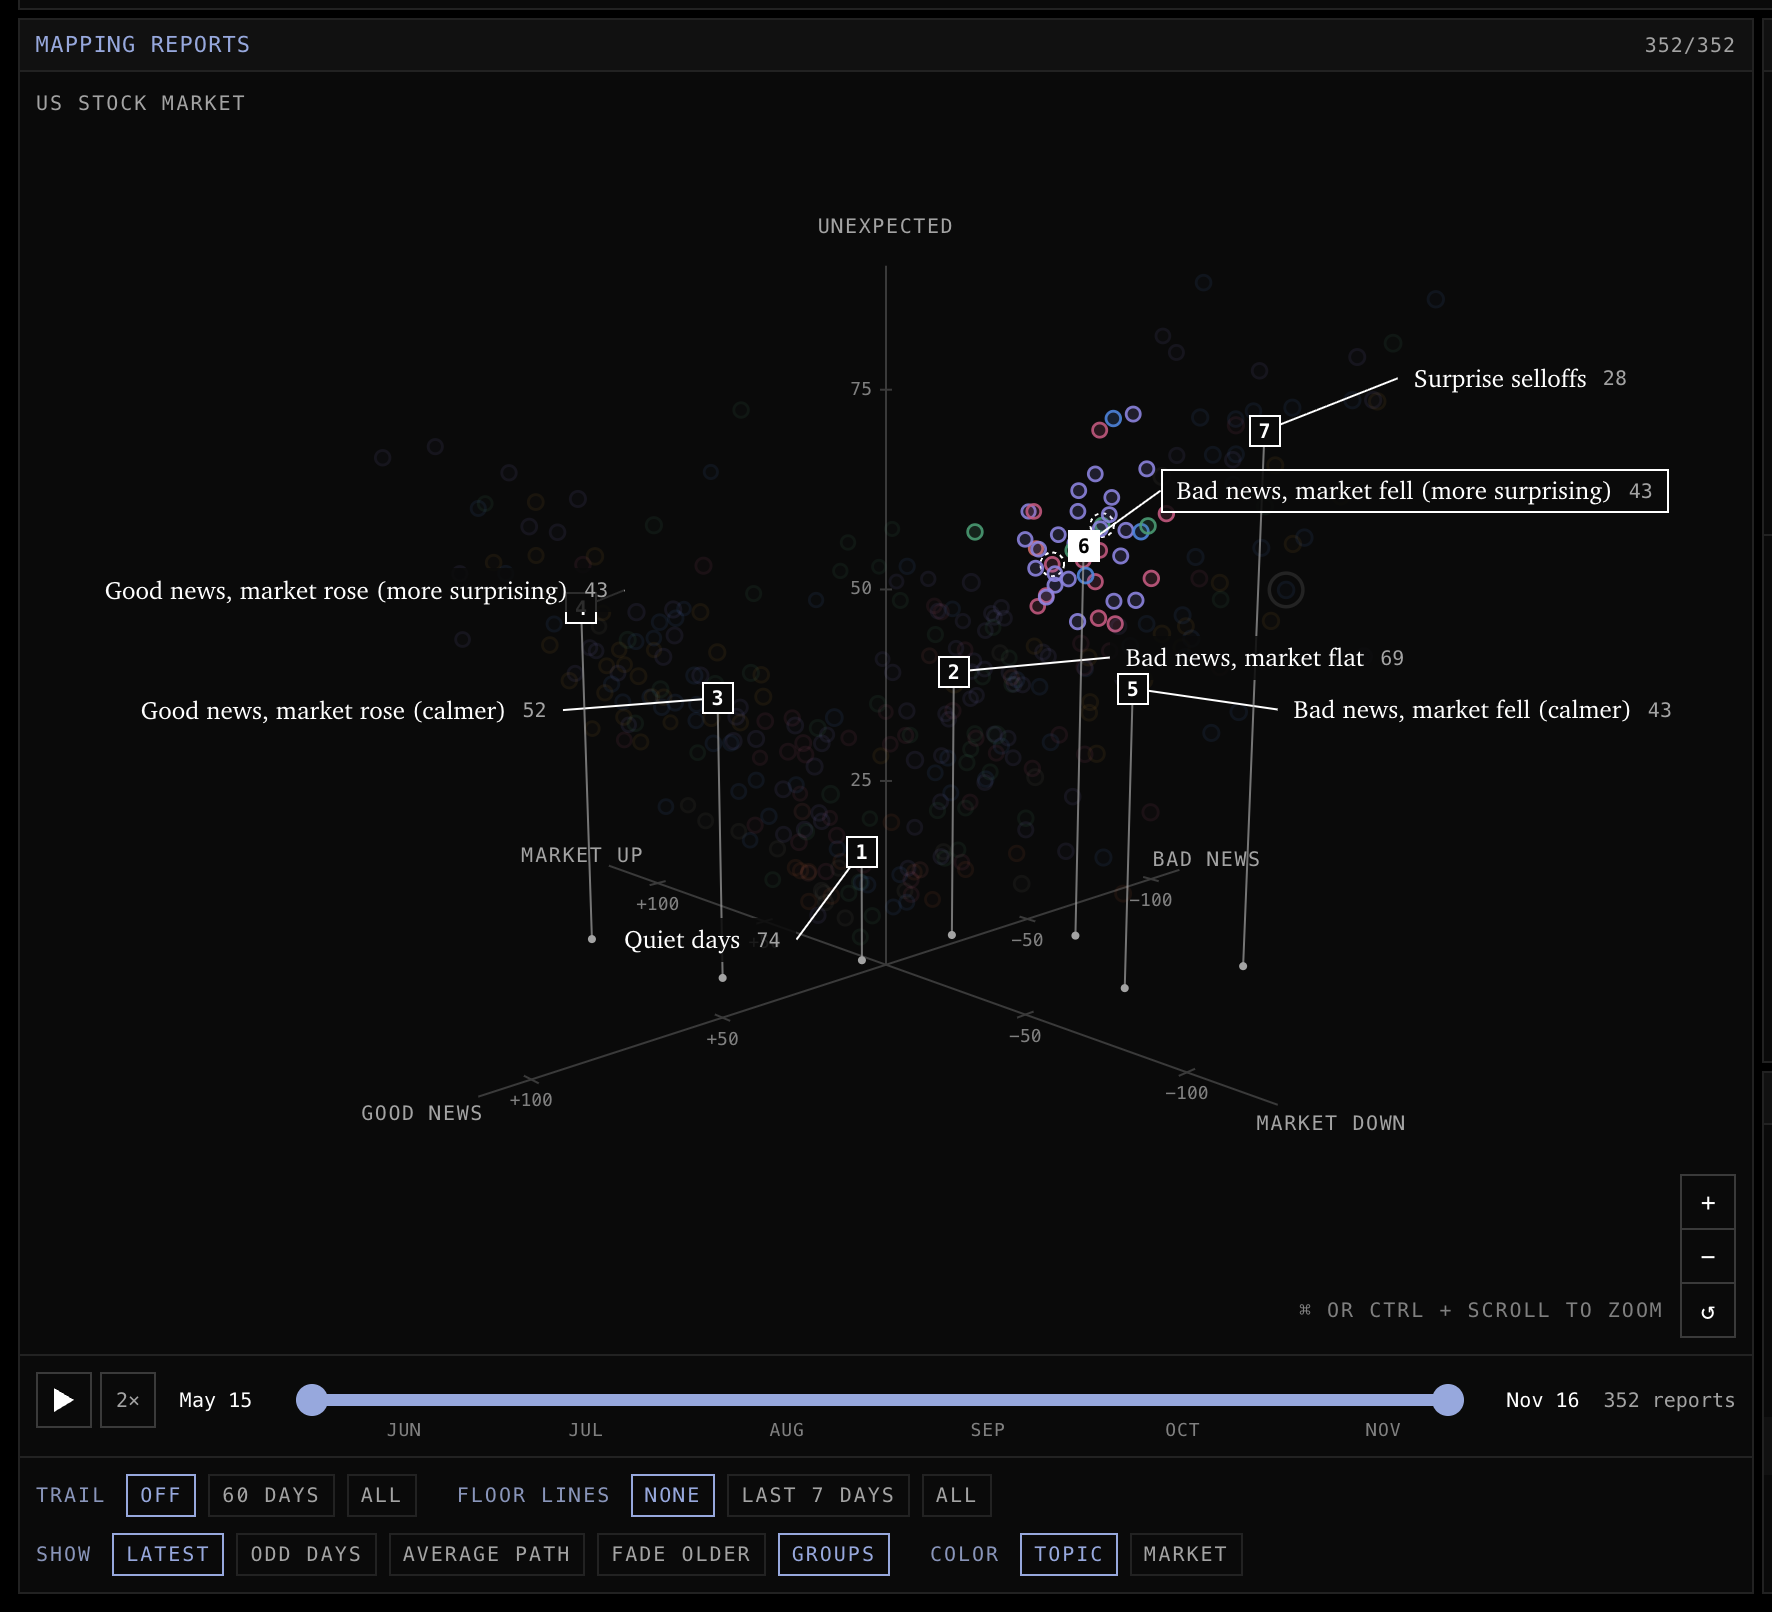
The Mapping Reports panel for the US stock market: a dark 3D scatter plot with every report as a colored ring between three axes, good news to bad news, market up to market down, and height for how unexpected the day was, with seven numbered groups called out with their report counts: quiet days, 74; bad news, market flat, 69; good news, market rose (calmer), 52; good news, market rose (more surprising), 43; bad news, market fell (calmer), 43; bad news, market fell (more surprising), 43; and surprise selloffs, 28. The more surprising bad news group is selected, so its rings stay bright while the rest are dimmed. A timeline from May 15 to November 16 covering 352 reports and a row of trail, floor line, show and color filters run underneath, with zoom controls in the corner
Interactive 3D graph

Mobile UI

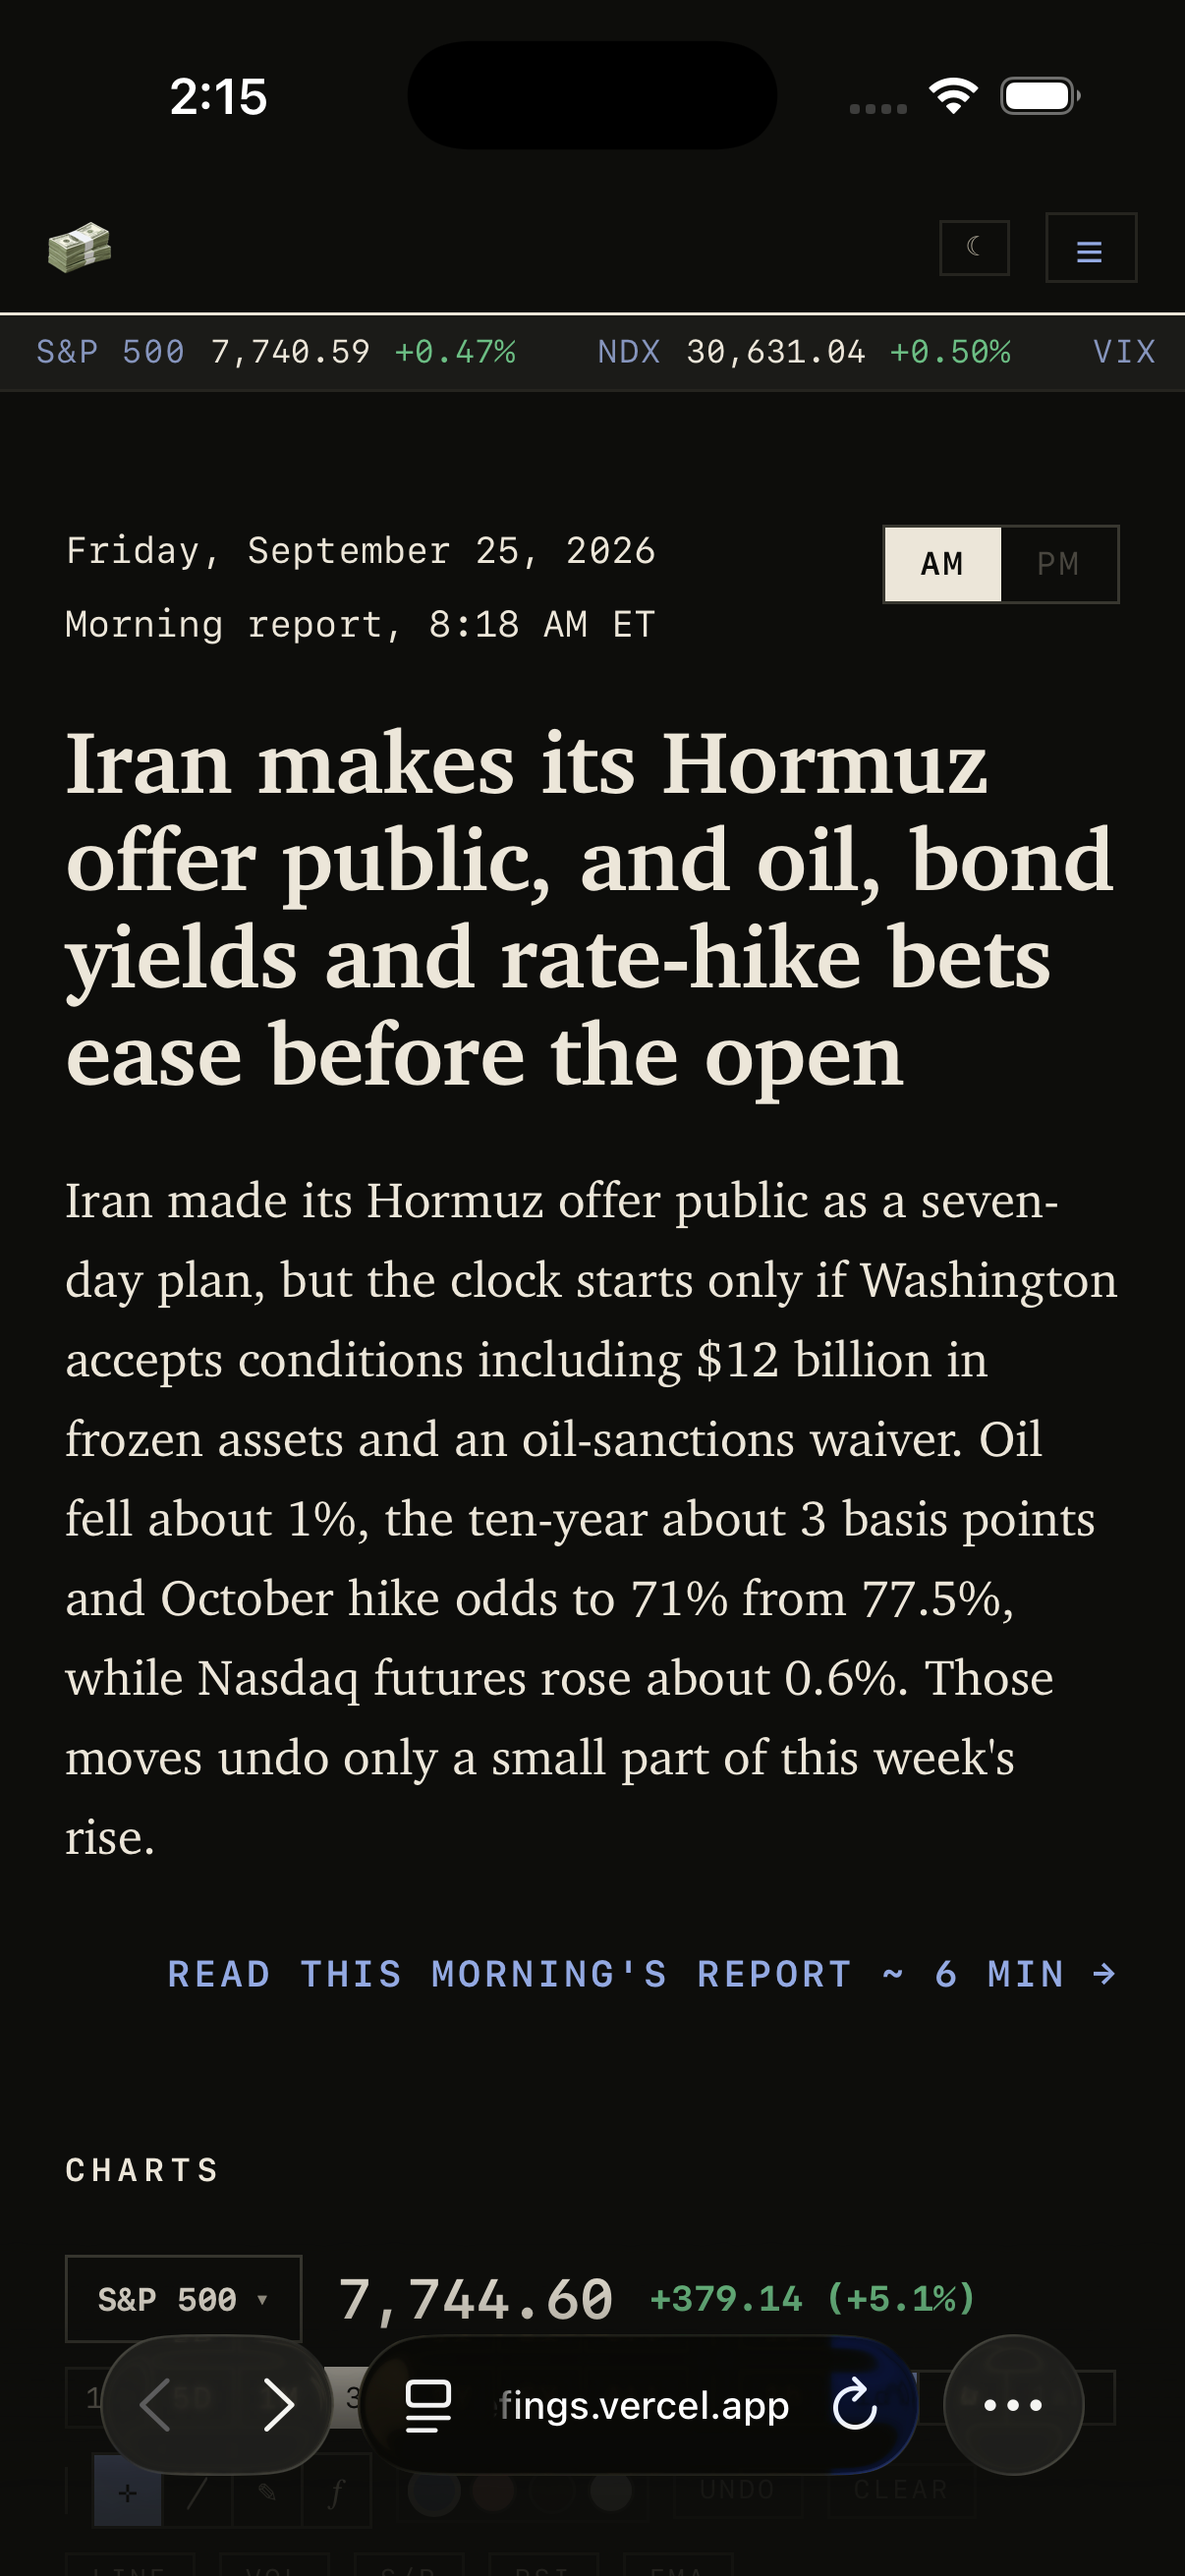
The Today page on a phone in dark mode: the ticker strip under the nav, Saturday, November 14, 2026 with the morning report from 7:50 AM ET and an AM/PM toggle set to AM, the headline on the Fed flagging AI-driven stock valuations as a risk just before Nvidia reports and Anthropic lists, its summary paragraph, a link to read this morning’s four-minute report, and the top of the Charts section
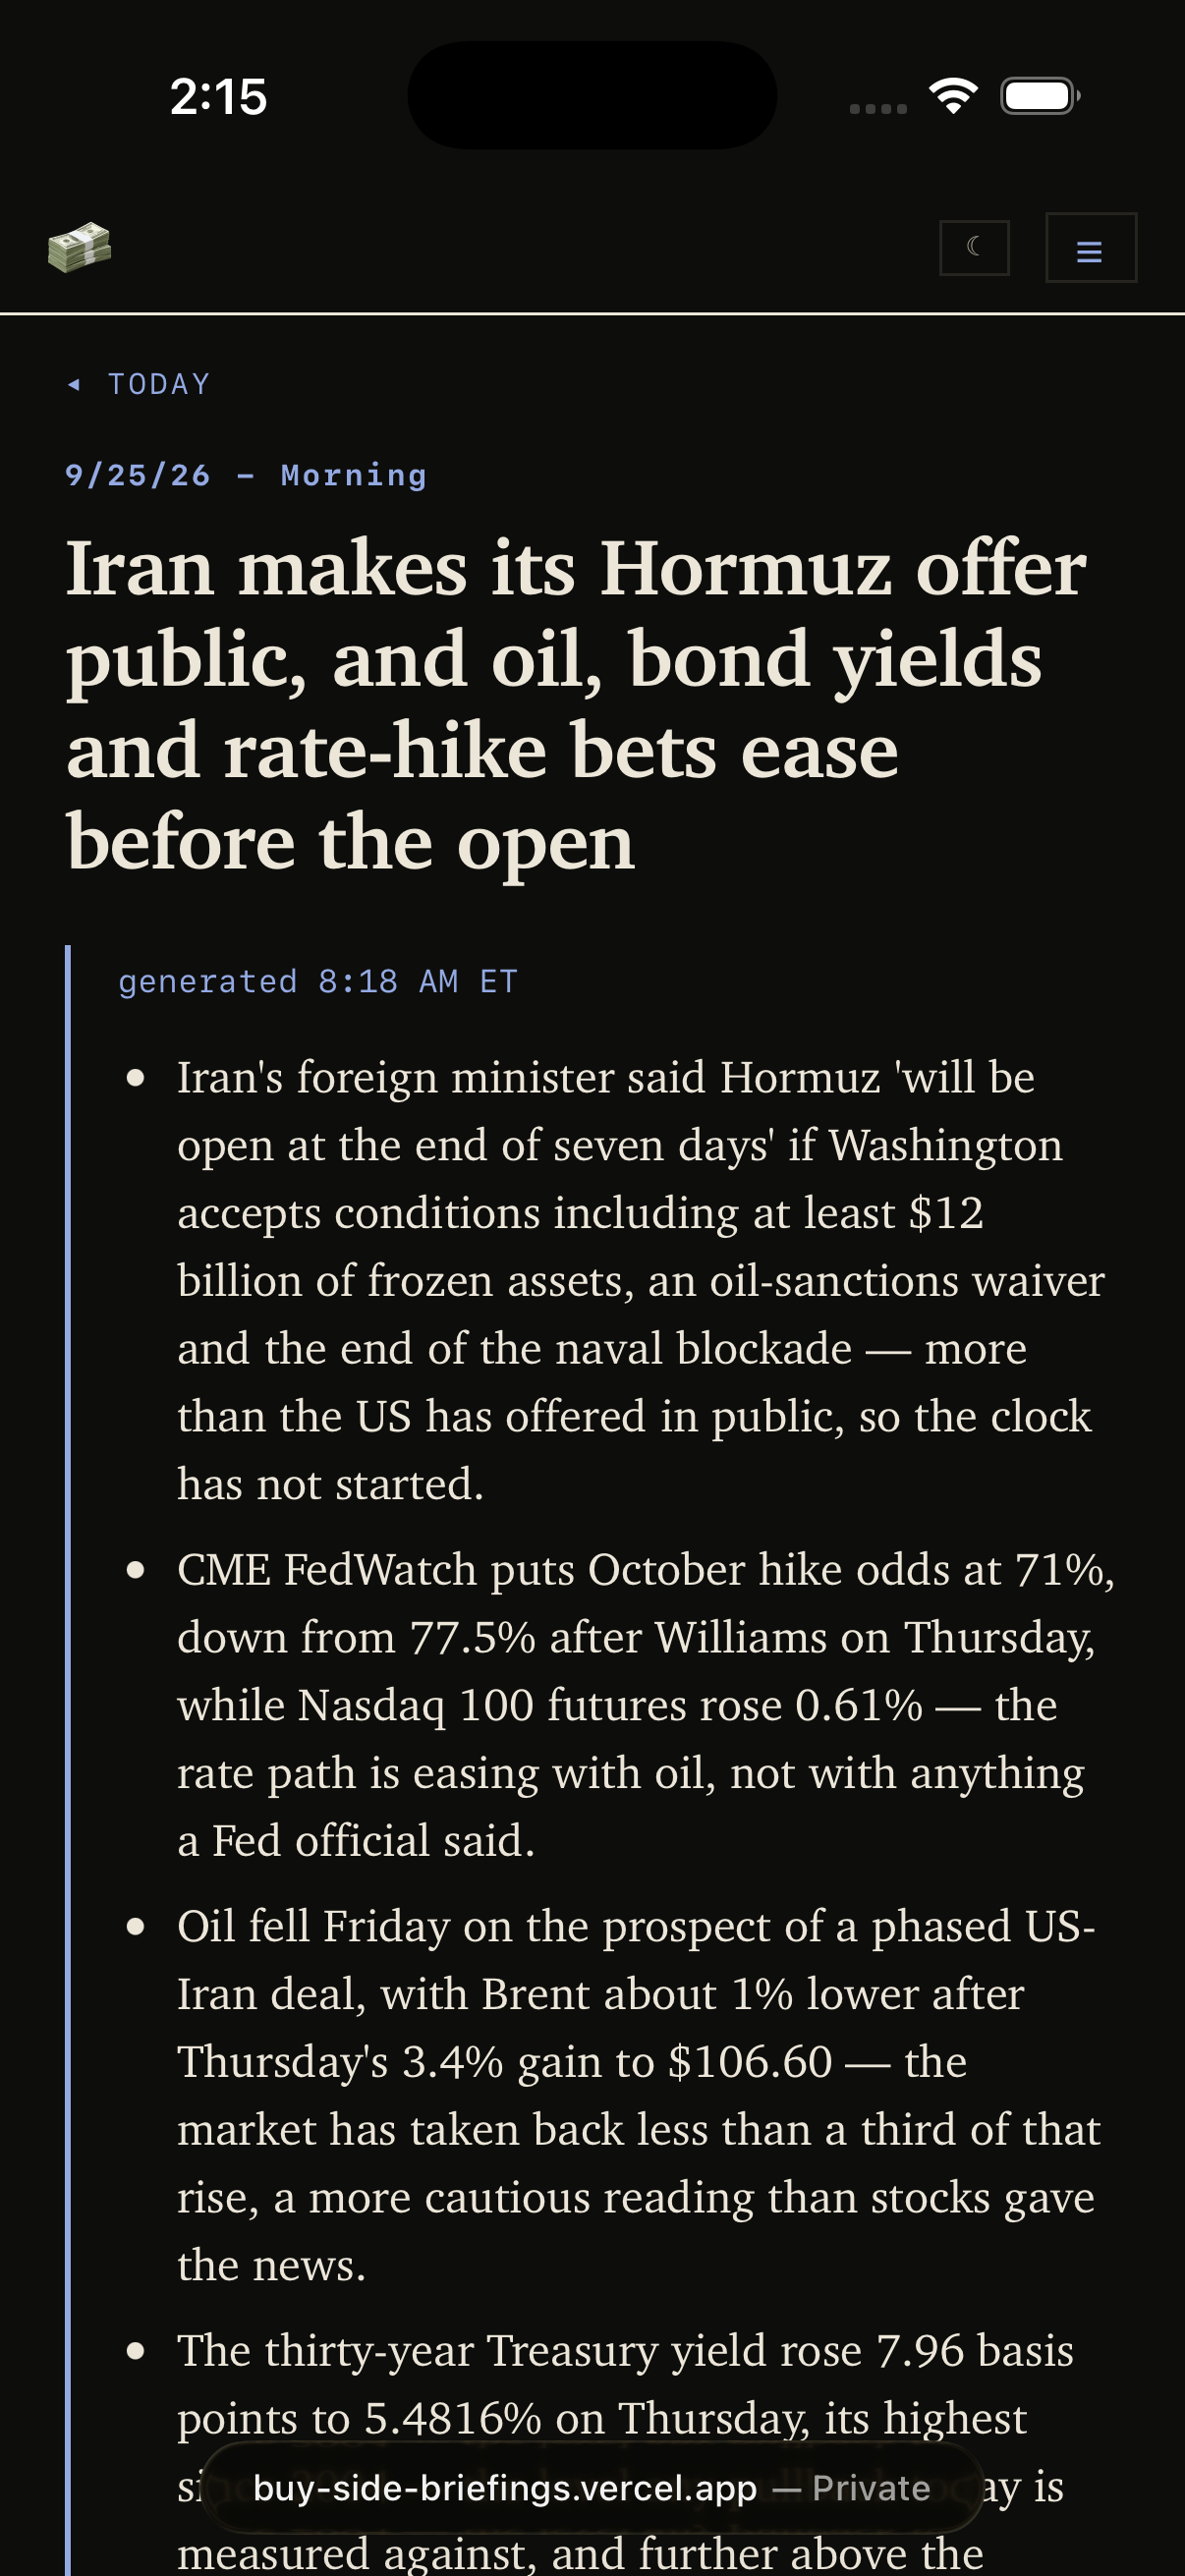
The full read on a phone in dark mode: a back link to Today, 11/14/26 Morning with a four-minute read estimate, the headline on the Fed’s stability report saying enthusiasm for AI is keeping stock valuations high and hedge fund borrowing is at a record, three days before Nvidia reports, the time it was generated, then bulleted takeaways with a Federal Reserve source link
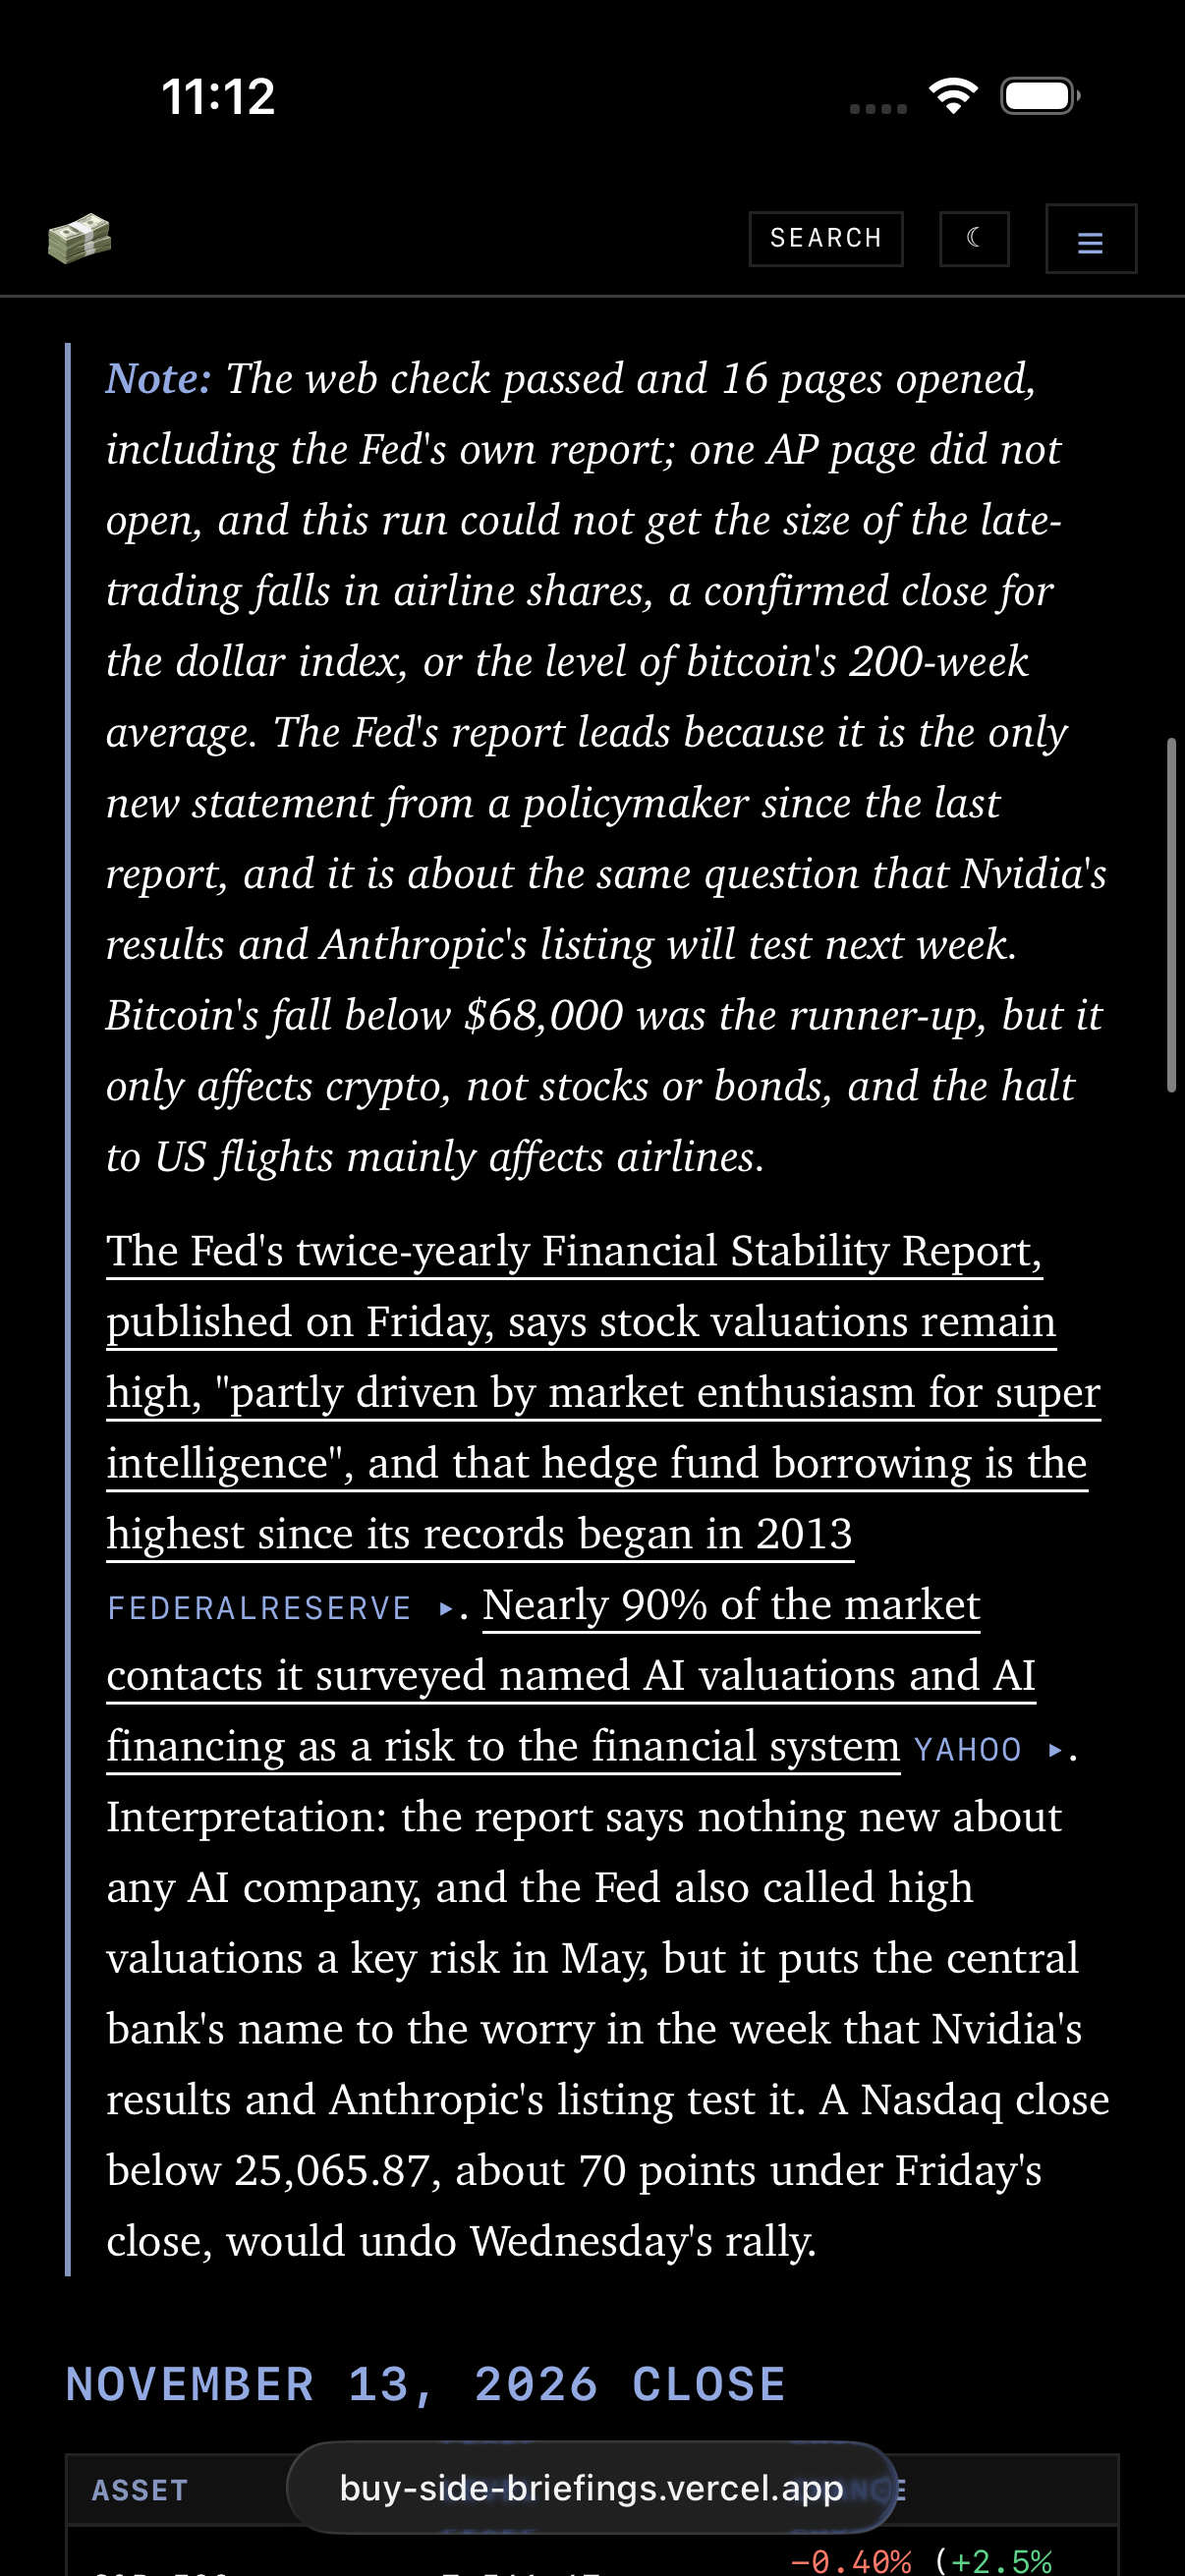
The lead of the full read on a phone in dark mode, set off by a blue rule down the left: an italic note saying the web check passed and 16 pages opened, listing what the run could not get and why the Fed’s report leads over Bitcoin’s fall, then a paragraph on the Financial Stability Report with underlined sourced passages, Federal Reserve and Yahoo source links, and a sentence marked as interpretation

Results

This product has changed many times. Initially it focused on short/mid-term trading by looking for opportunities and recommending buy/sell signals. However, we realized that a strictly informational website was more useful for investing in the long-term and could provide value to readers. Buy Side used to display a lot more data but we cut it down and structured the reports so they would be easier to digest.

Buy Side is a system modeled after human decision making processes in trading and investing, that leverages AI to provide unique insights through data analysis and pattern recognition. The system investigates the narratives that drive behavior (market movement) and sentiment (investor perception) from multiple perspectives (micro/macro) to draw conclusions. By discovering trends in behavior and understanding how narratives shape the market, we can use that information to make educated predictions about the future.